EURUSD Market Behavior Notes
Learn why the market behaved that way before planning the next trade.
These are not generic signal posts. Each insight explains what retail did, how liquidity moved, what auction value accepted or rejected, and how a trader can turn that context into a disciplined idea.

The EURUSD Macro Stack: Fed vs ECB, Bond Yields, COT Positioning, and Auction Value
A practical top-down EURUSD framework for reading the Fed/ECB policy path, bond-yield spreads, COT positioning, and auction-market execution levels.

Trading the Rotational Fight: EURUSD After Weak NFP and Softer Eurozone CPI
A practical EURUSD map after weak US labour data, softer Eurozone inflation, mixed session flow, and Friday's return back into value.
The Engine of Global Capital: Fed Policy, Bonds, and Order-Flow Drift
How the Fed reaction function, bond yields, and institutional order splitting turn macro data into persistent order-flow drift.
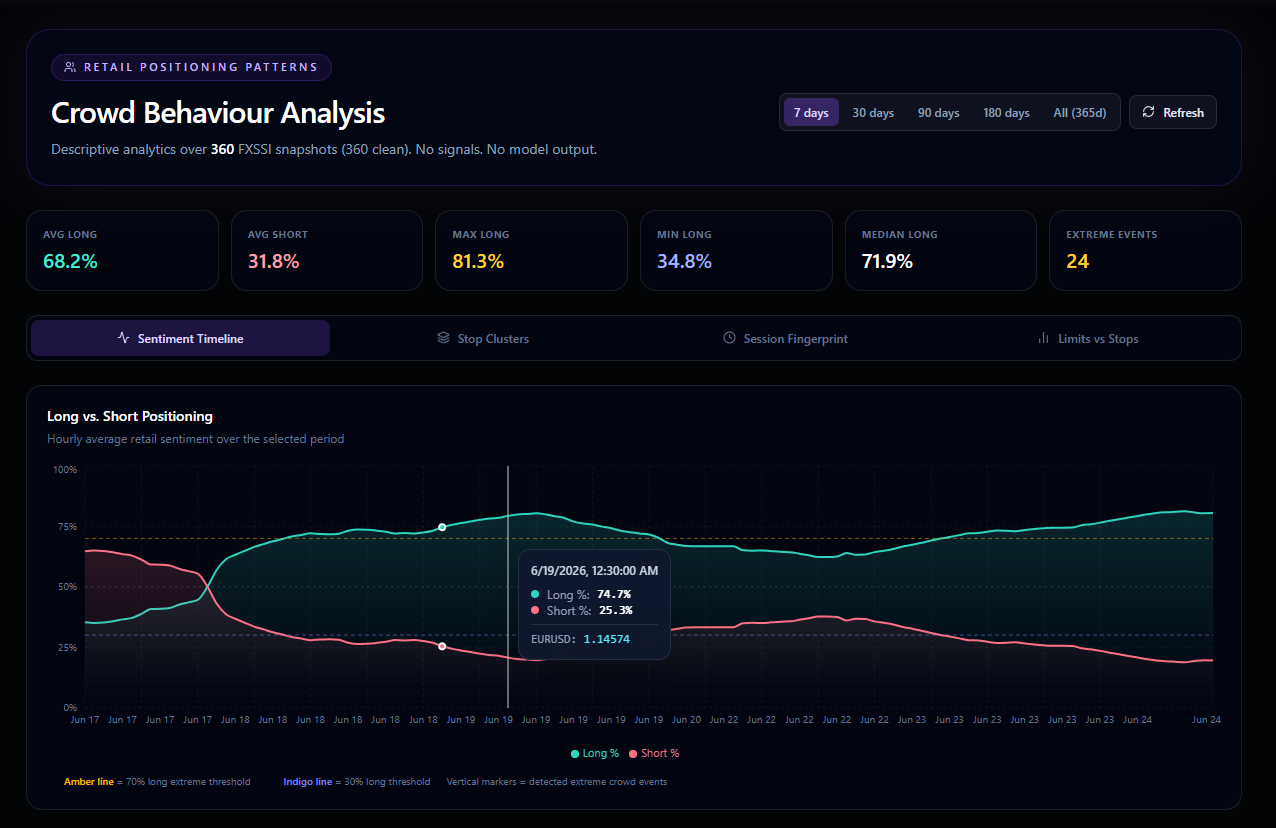
Retail Positioning Patterns: How We Read Crowd Behaviour Without Turning It Into A Blind Signal
A practical look at the TradersAnalytica liquidity archive: retail long/short bias, stop clusters, session fingerprints, and limits-vs-stops context for EURUSD.
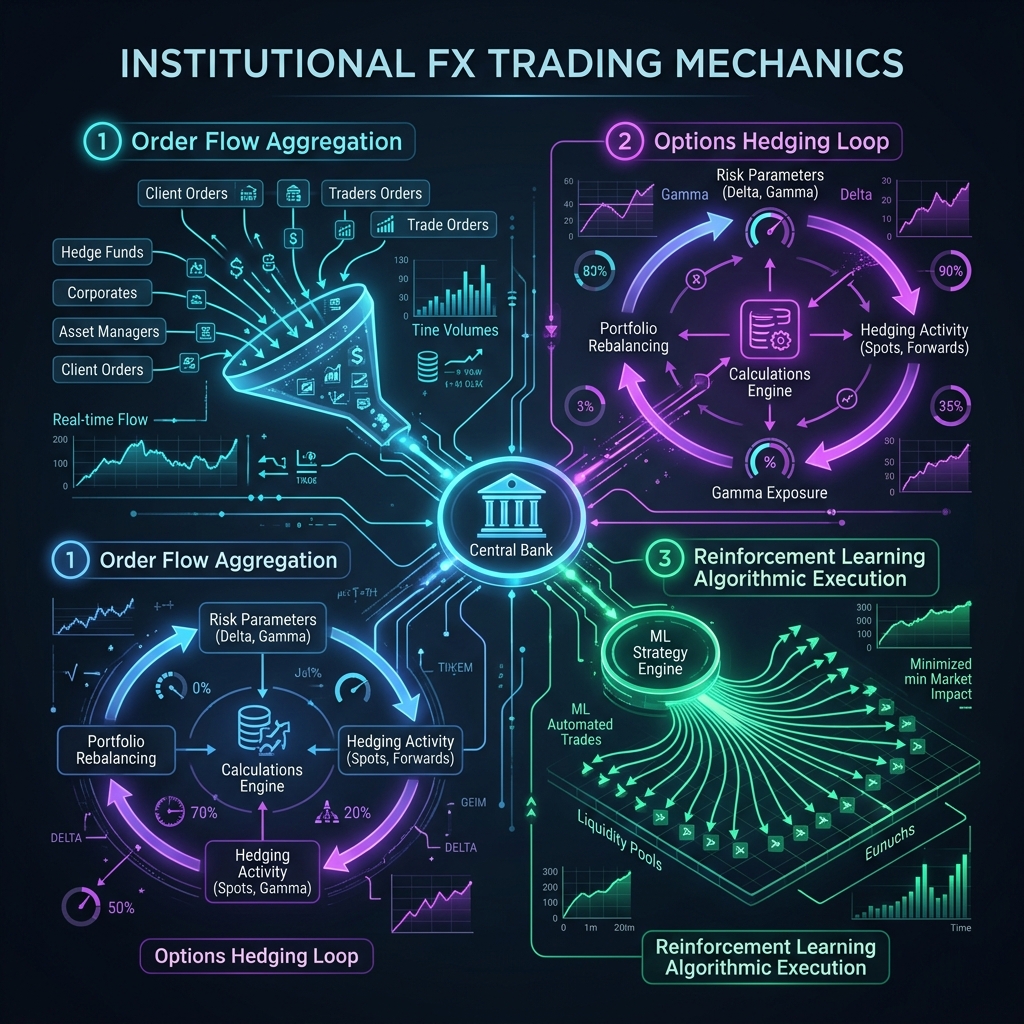
How Banks Trade Forex: Order Flow, Algorithmic AI Models, and Dynamic Delta Hedging
An inside look at how institutional FX desks use client order flow, Reinforcement Learning models, and dynamic delta-gamma hedging to operate market-neutral systems.
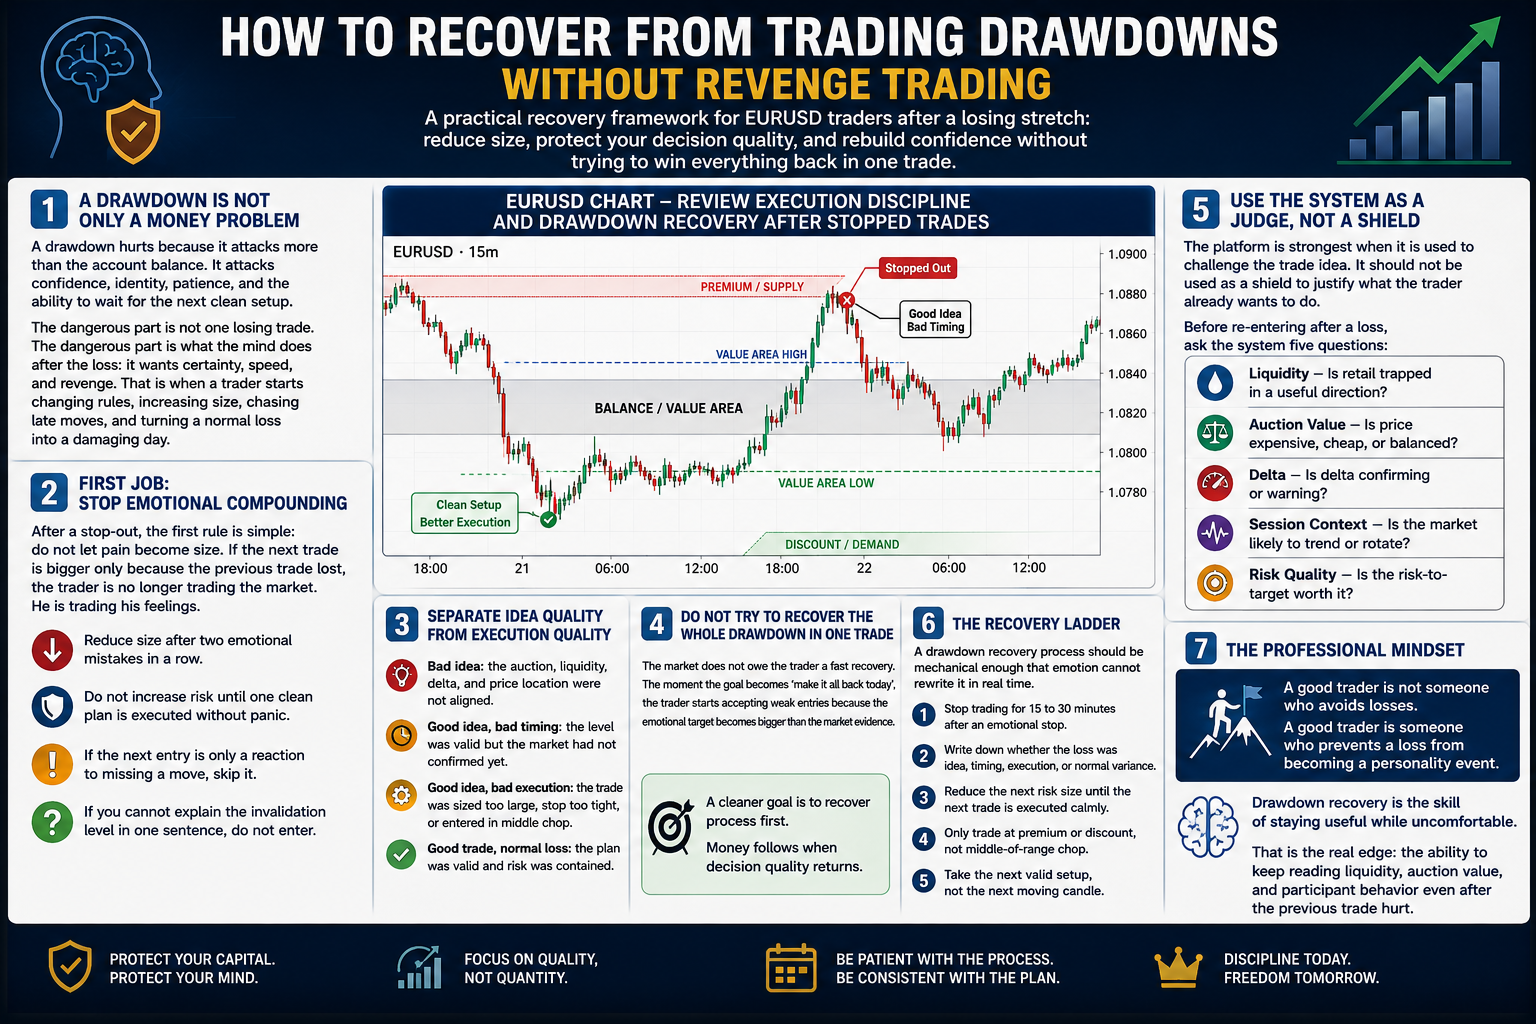
How To Recover From Trading Drawdowns Without Revenge Trading
A practical recovery framework for EURUSD traders after a losing stretch: reduce size, protect your decision quality, and rebuild confidence without trying to win everything back in one trade.
Why The Same EURUSD Level Works One Day And Fails The Next
A level is only useful when the market state behind it is still alive. This post explains why the same EURUSD price can reject one day and break the next.
Why Friday Markets Feel Different From Wednesday Markets
Friday can still respect levels, but the quality of movement often changes because positioning, event risk, liquidity, and weekend behavior change.
How Retail Long Percentage Helped Us Read The May 20-22 EURUSD Move
How changes in retail long percentage helped separate trap-loading, short covering, and lower-quality two-sided trade conditions during the May 20-22 sequence.

When A Sell Limit Is High Probability And When It Is Just Hope
A sell limit becomes higher probability when it sits at a meaningful retest with auction, liquidity, retail behavior, and invalidation all aligned.
Why Positive Delta Can Be Dangerous For Short Sellers
Positive synthetic pressure can warn shorts that buyers are active, but it can also reveal absorption when price fails to continue higher.
What A V-Shape Reversal Really Means In EURUSD
A V-shape is not automatically bullish or bearish. The real question is whether the recovery becomes accepted value or only squeezes into supply.
How Auction Value Helps Avoid Late Entries In EURUSD
A practical guide to using VAH, POC, VAL, profile shape, and value migration so you stop selling lows or buying highs after the real entry has passed.
How Liquidity Clusters Build, Absorb, Withdraw, And Migrate
A simple framework for reading liquidity cluster life cycles so a trader can tell the difference between a real wall, absorption, and order migration.
Why We Do Not Trade Every Liquidity Alert
A practical explanation of why alerts are treated as research context, and why the best trade can be waiting for the retest instead of chasing the alert.
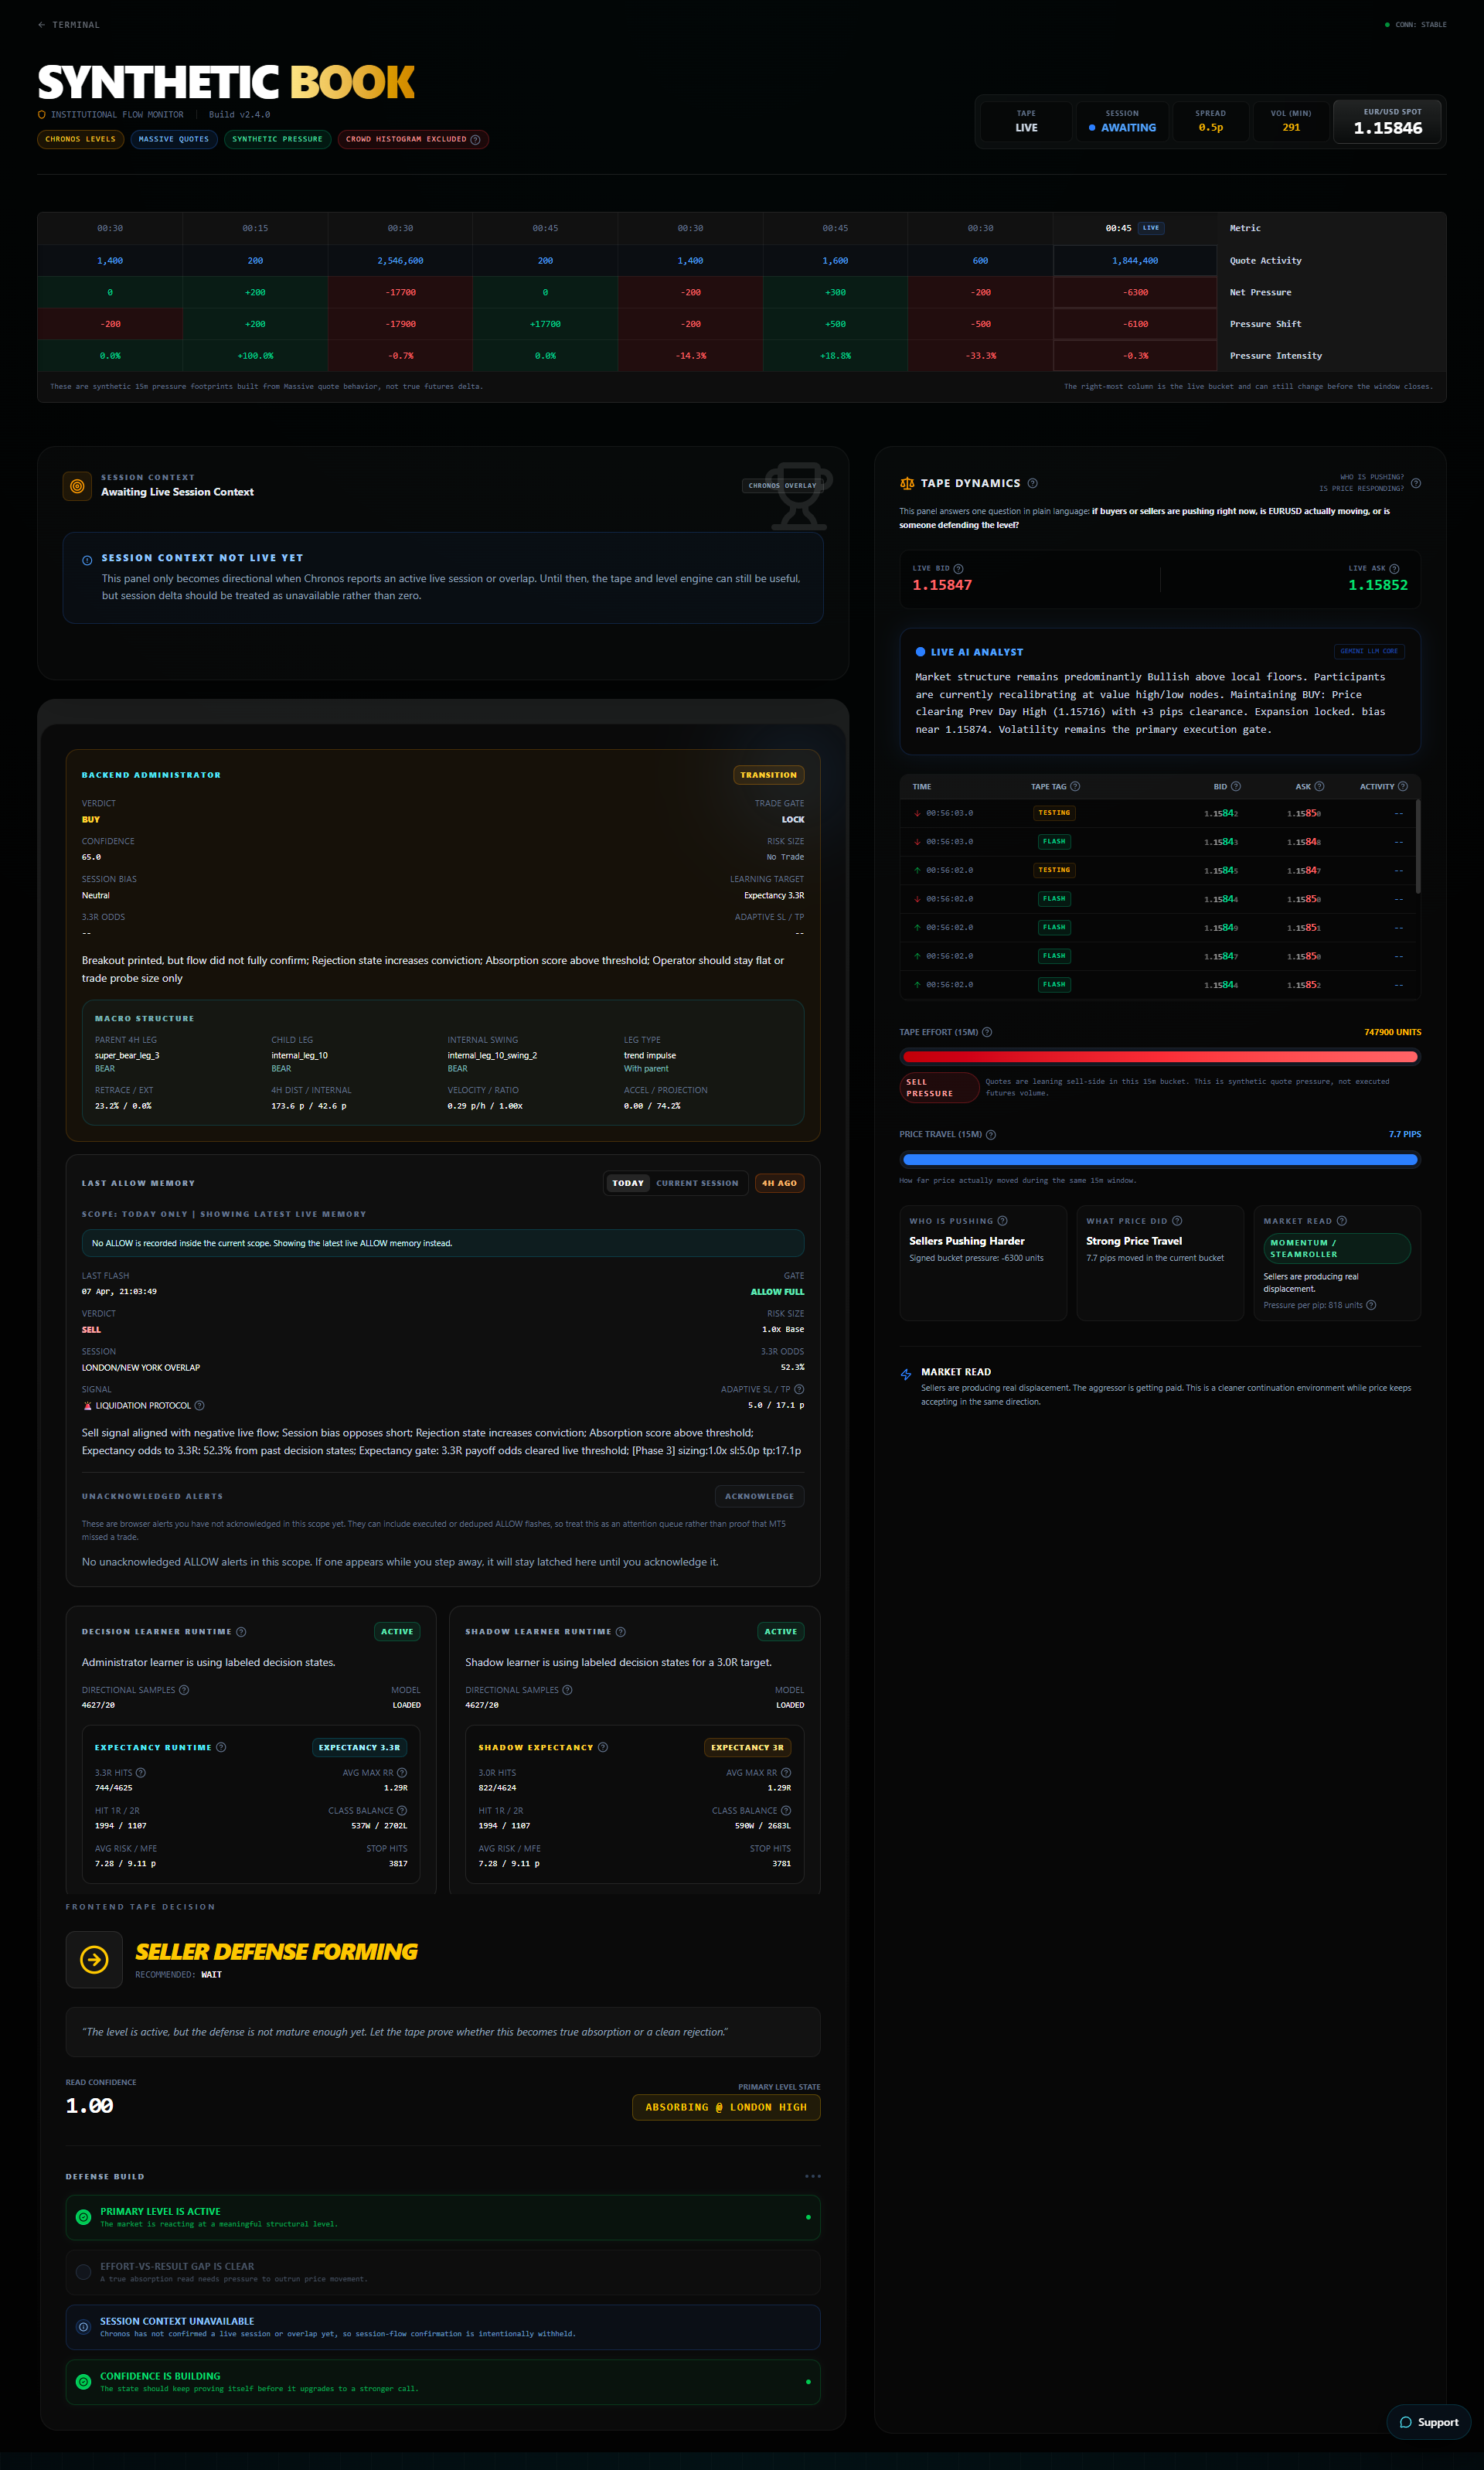
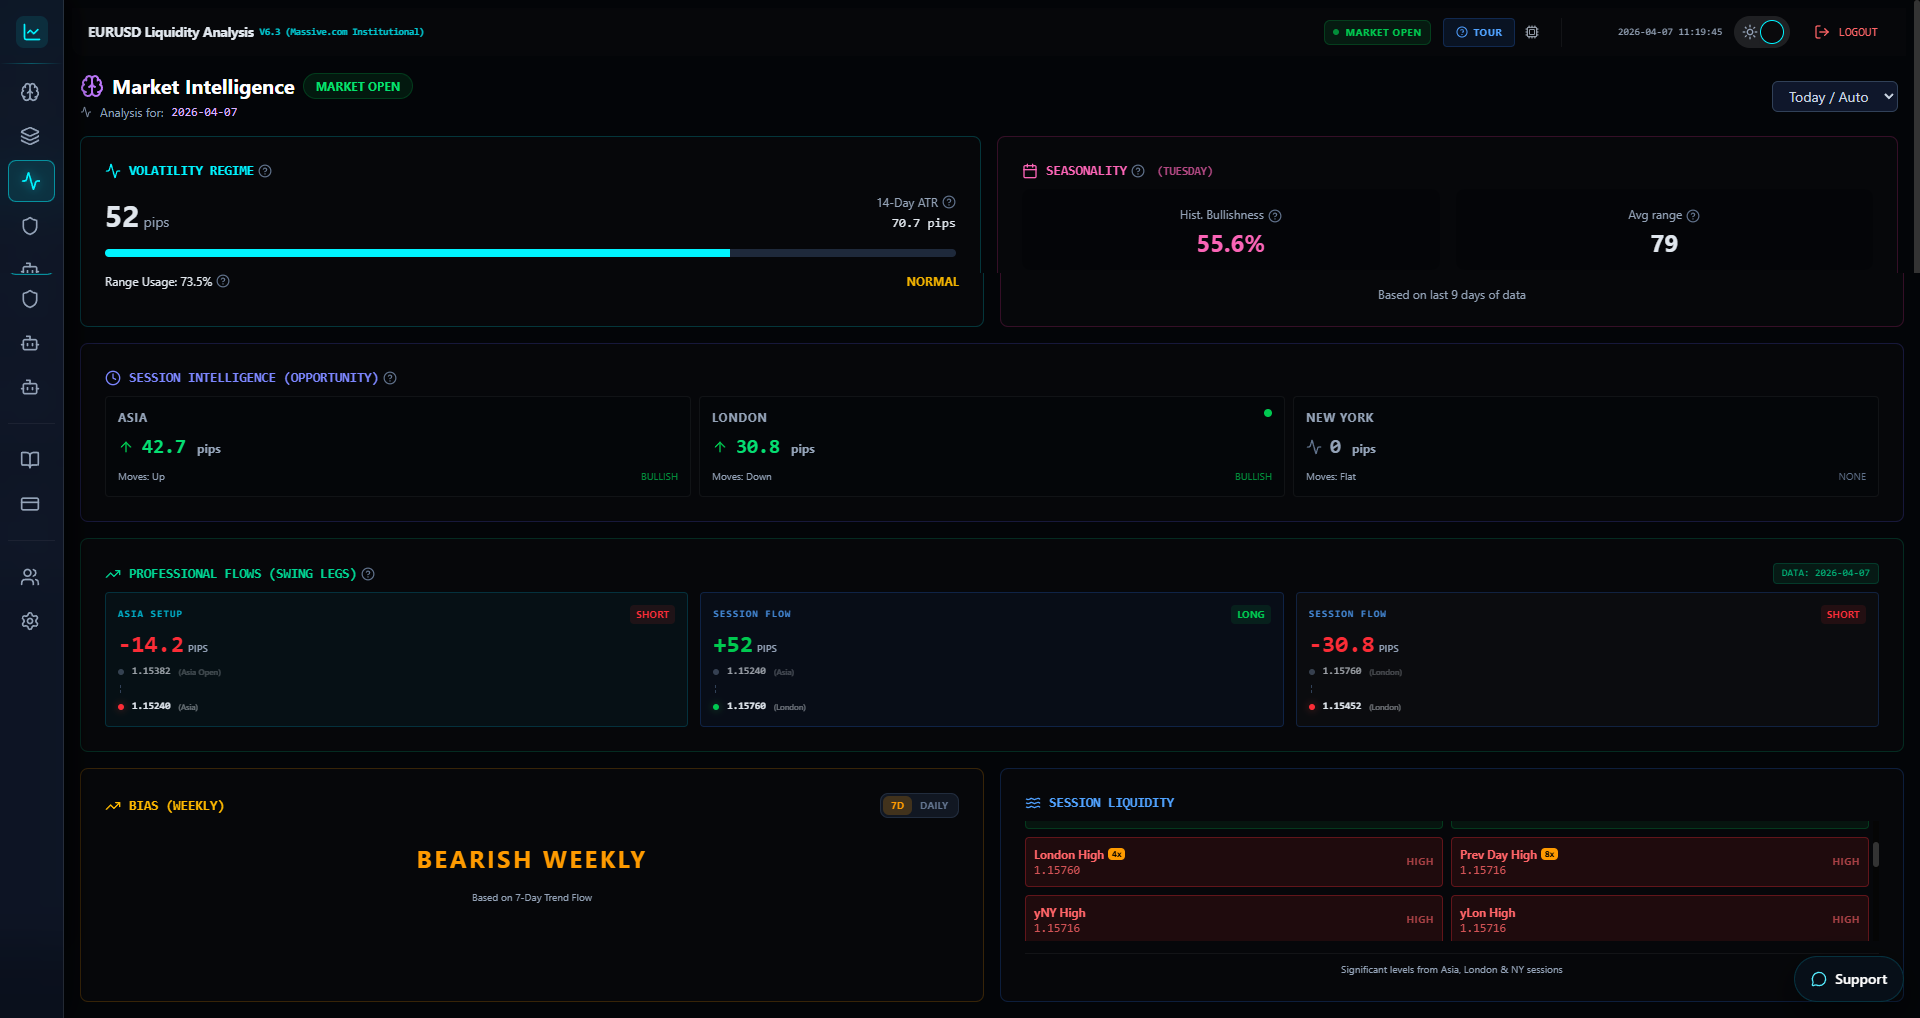
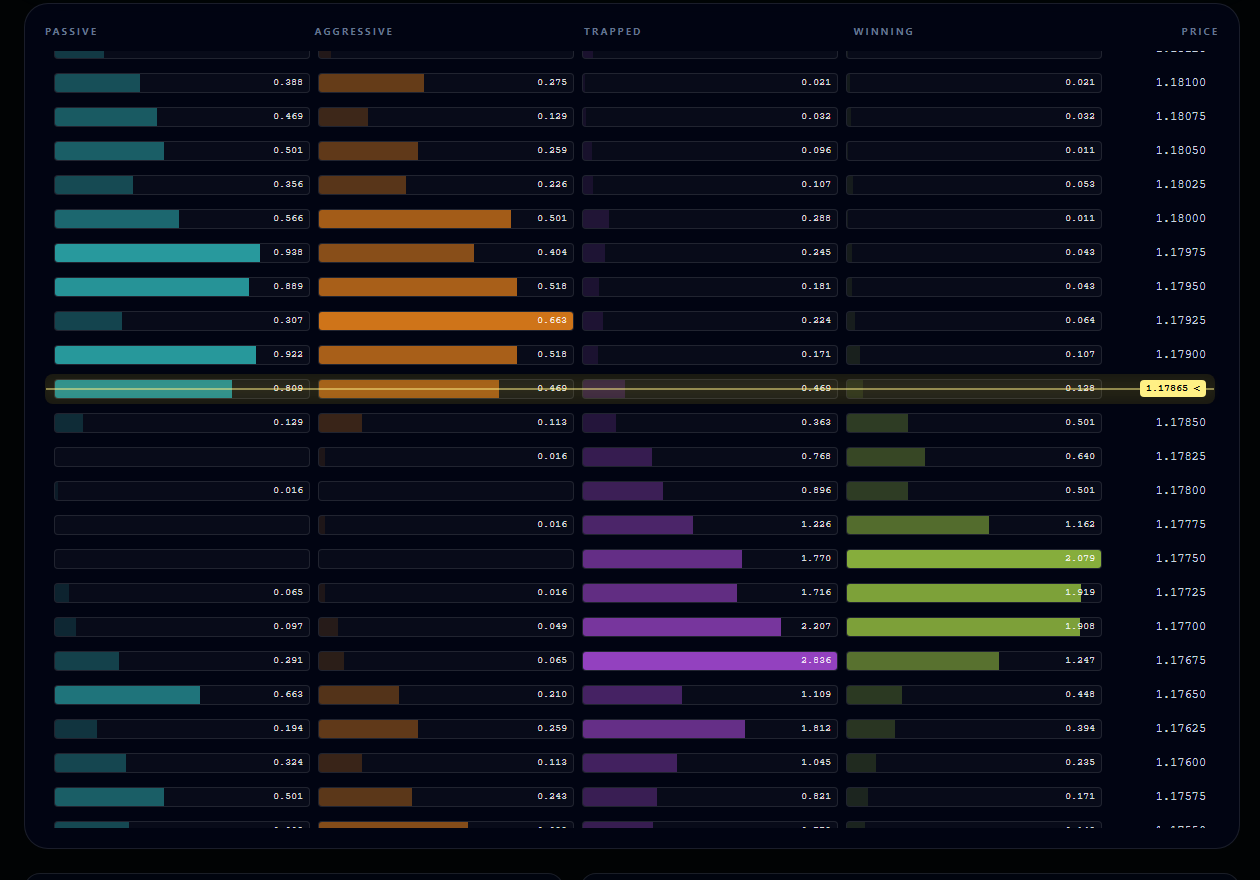
How To Read TradingAnalytica For EURUSD Trade Ideas: A Step-By-Step Workflow
A retail trader workflow for turning the dashboard, auction model, liquidity heatmap, delta, and alerts into a disciplined EURUSD trade idea.
Retail Behavior Around Liquidity Data: Why EURUSD Runs Differently From One Day To The Next
A practical read of how retail positioning, liquidity clusters, auction value, and volatility changed across the May 20-22 EURUSD sequence.