Retail Positioning Patterns: How We Read Crowd Behaviour Without Turning It Into A Blind Signal
A practical look at the TradersAnalytica liquidity archive: retail long/short bias, stop clusters, session fingerprints, and limits-vs-stops context for EURUSD.
Why the liquidity archive matters
Retail positioning is useful, but only when it is treated as context. A crowd being long is not automatically a sell signal, and a crowd being short is not automatically a buy signal. The edge starts when positioning is joined with price location, auction value, trapped inventory, and session behaviour.
The liquidity archive stores clean FXSSI snapshots so the system can study how retail traders behave around EURUSD value areas. It is deliberately research-first: the page describes the crowd, stop pools, and session fingerprints, but it does not generate trade alerts or replace the decision supervisor.
- The archive separates clean snapshots from quarantined or degraded data.
- The dashboard shows what retail is doing before we ask whether it matters.
- The read stays descriptive until AMT and price action confirm a real scenario.
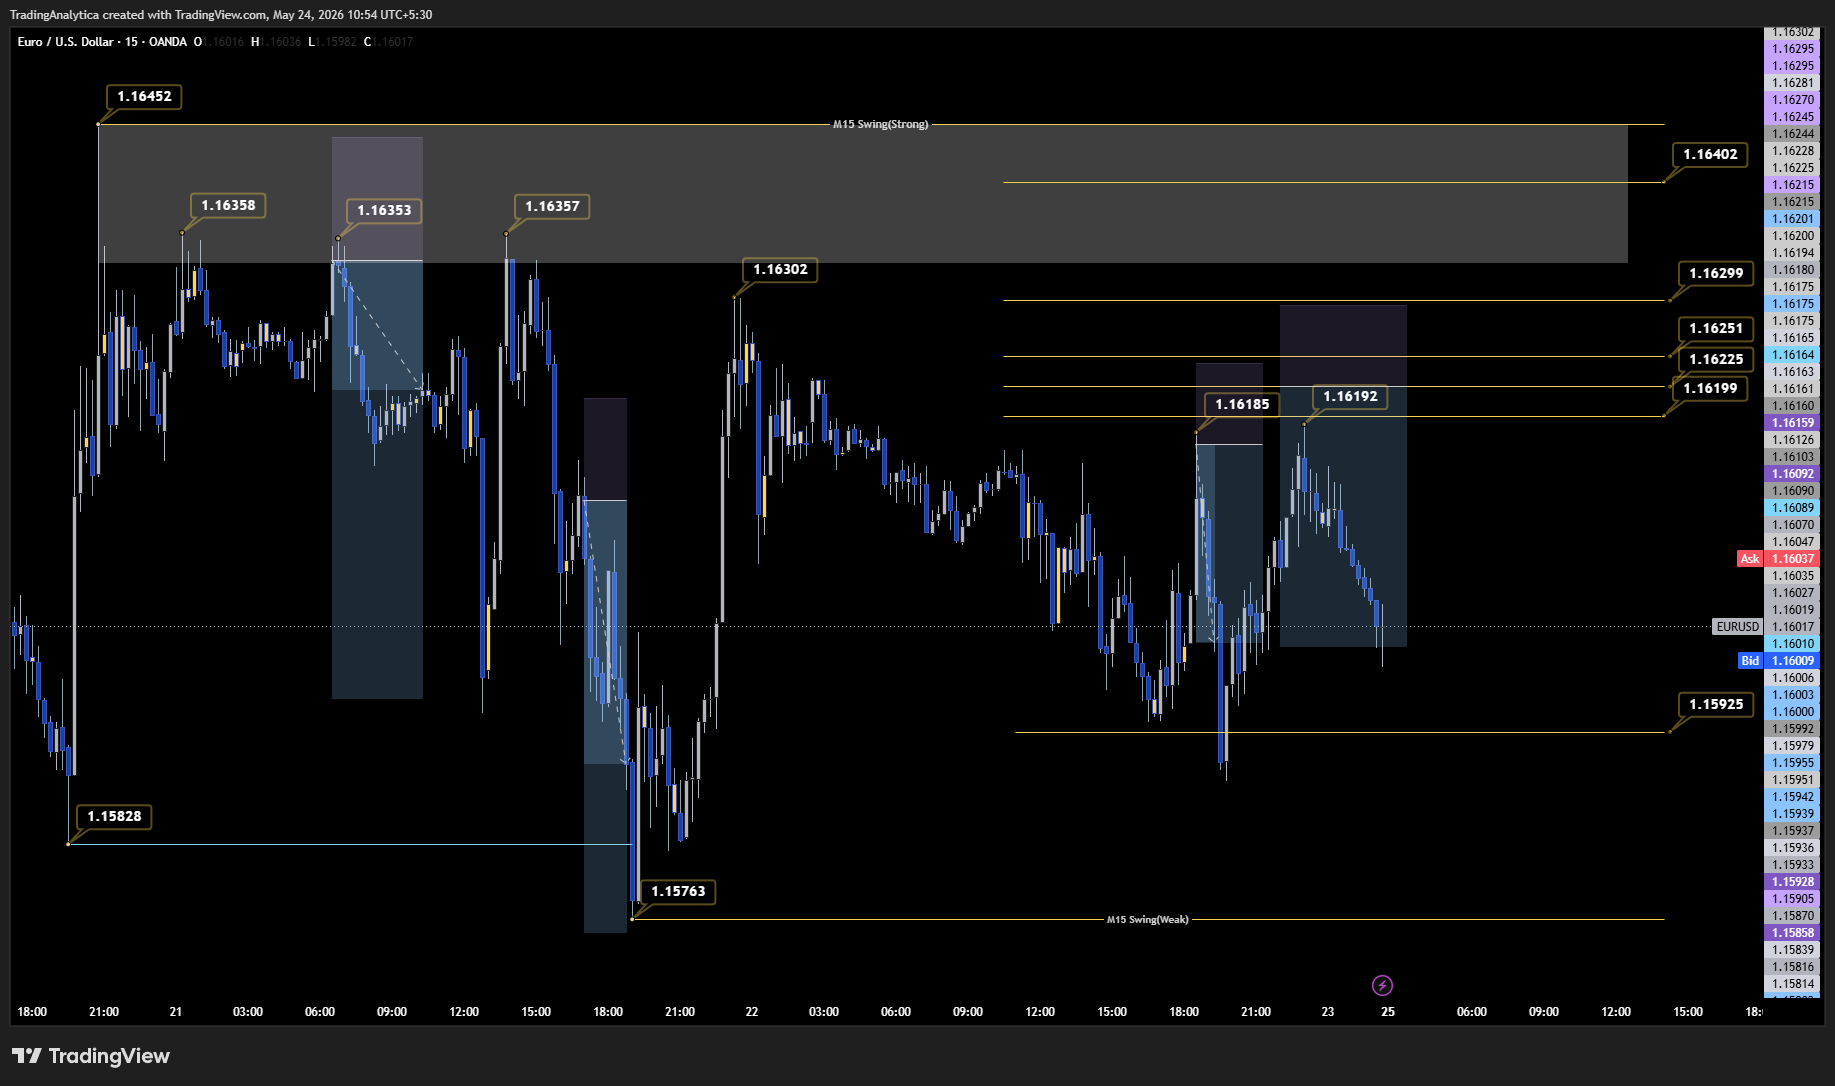
The first read: sentiment timeline
The timeline shows how the crowd shifts between long and short exposure through the week. In the screenshot, retail long exposure is elevated while EURUSD is trading lower, which is the type of environment where dip buyers can become trapped if price keeps accepting below value.
The key is not the percentage alone. A 70% long reading near a defended VAL is different from 70% long while price is failing to reclaim POC. The same number means different things depending on where the auction is accepting value.
- Longs increasing while price falls can show trapped dip-buying.
- Shorts increasing while price rises can show squeeze risk.
- Neutral positioning usually needs more auction evidence before it matters.
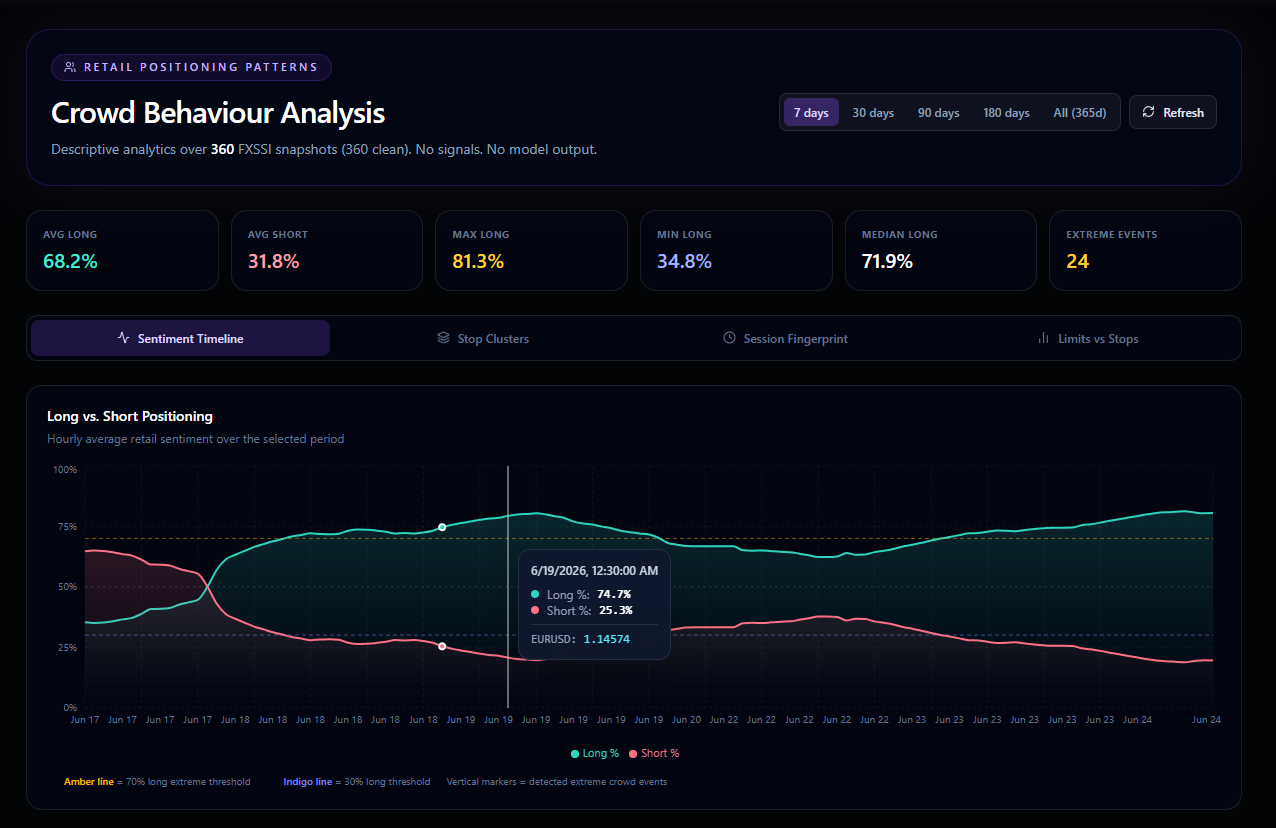
Stop clusters show where forced liquidity can sit
The stop-cluster view aggregates where retail stop orders have historically concentrated. These levels are not magic magnets, but they are useful liquidity references when price is already migrating toward them.
A downside stop pool below value is more meaningful when the market has accepted lower, trapped longs remain exposed, and cumulative pressure fails to recover. A stop pool against a balanced auction is only a reference point, not a trade thesis.
- Stop clusters help identify where forced exits may sit.
- They require auction confirmation before becoming actionable context.
- The system keeps them separate from trade approval logic.
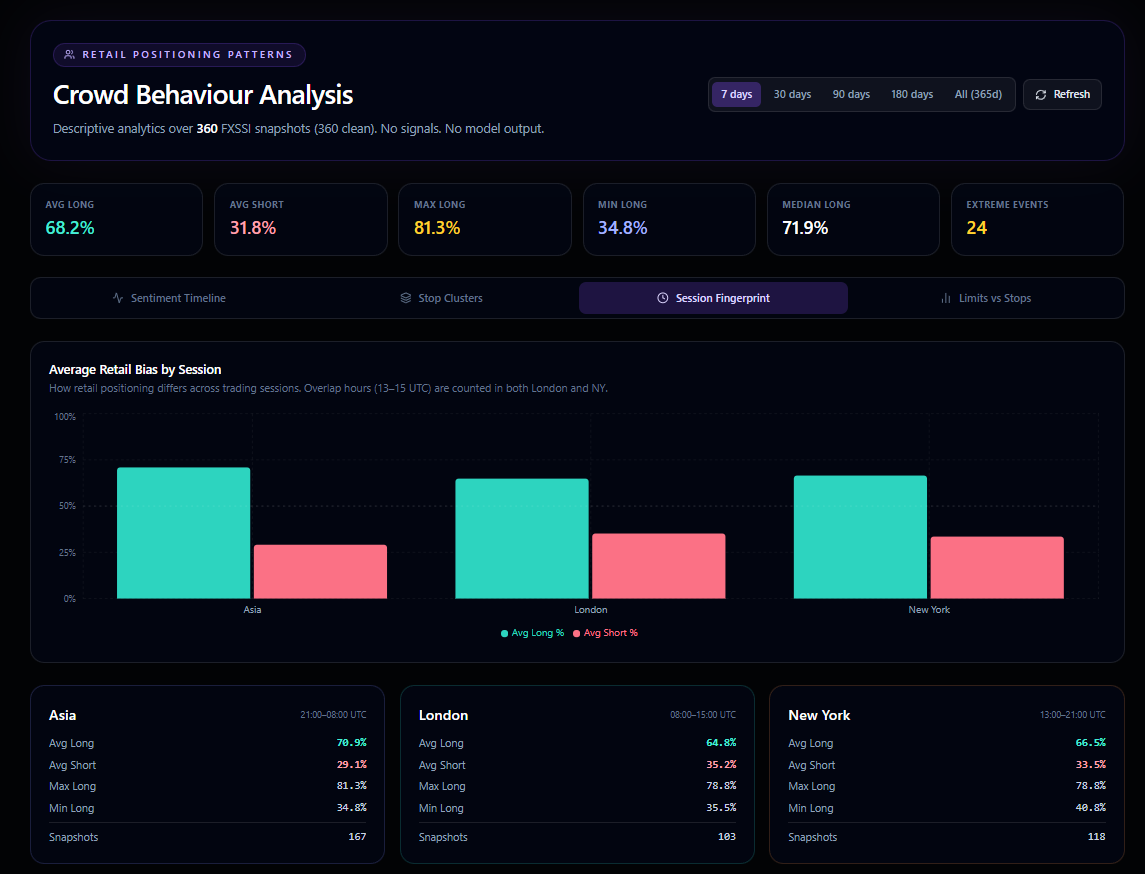
Session fingerprints explain when the crowd is most exposed
The session fingerprint breaks the same retail behaviour into Asia, London, and New York. That matters because the same crowd bias can have a different meaning depending on which session is building or rejecting value.
For example, Asian dip-buying can survive inside a quiet range. The same long exposure becomes more dangerous if London opens, rejects the prior value area, and starts pushing price toward stops. This is why the dashboard is useful: it turns raw crowd percentages into session-aware context.
Limits versus stops tells us whether retail is fading or chasing
The limits-vs-stops panel gives a simple behavioural clue. When limit orders dominate, retail is usually trying to fade the current move. When stop orders dominate, retail is more likely chasing momentum or entering late through breakout-style orders.
This is not a standalone edge. It becomes useful when paired with AMT: value acceptance, failed auction, POC reclaim or rejection, and whether price is approaching a known liquidity pocket.
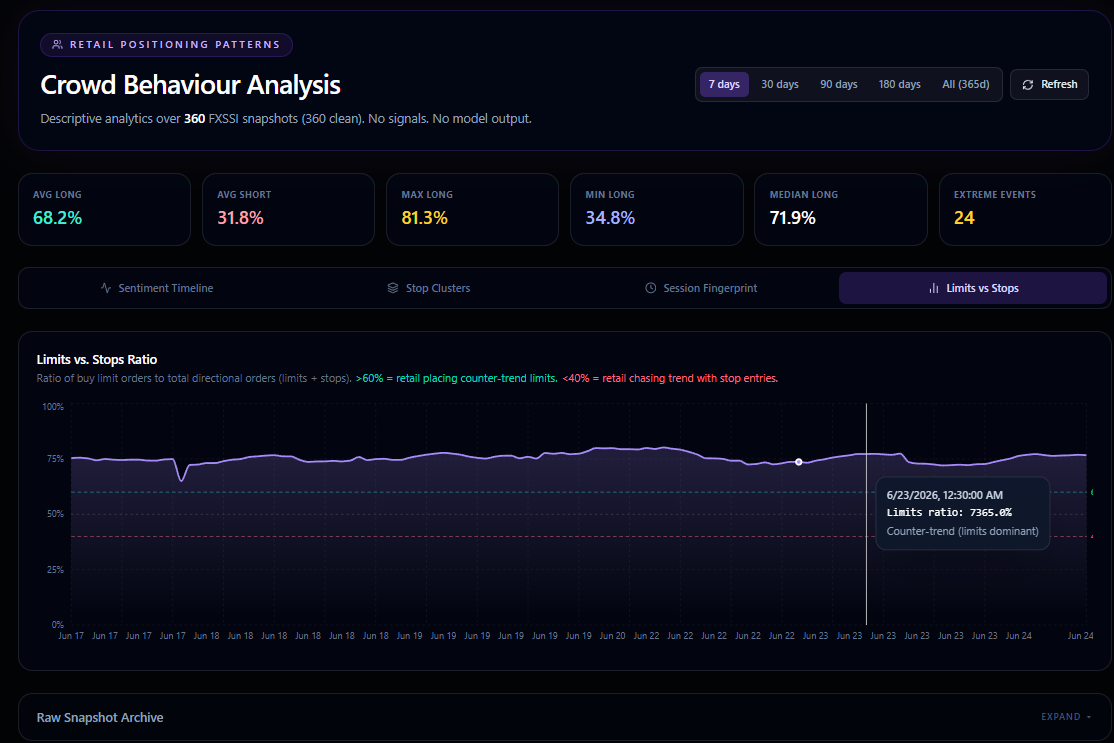
- High limits ratio can mean retail is fading the move.
- Low limits ratio can mean retail is chasing continuation.
- The page should be read with VAH, VAL, POC, and price acceptance.
The professional takeaway
This dashboard is strongest when it answers one practical question: what is the crowd doing, and are they likely trapped or comfortably positioned? That answer then supports the auction read; it does not replace it.
For TradersAnalytica, the liquidity archive becomes a research layer under the core EURUSD workflow. It helps explain retail behaviour, but the final decision still needs value-area context, price-action confirmation, risk gating, and forward-validation discipline.
- Good use: identify trapped retail behaviour around accepted value.
- Bad use: short every high long percentage without auction confirmation.
- Correct workflow: retail behaviour plus AMT plus price response plus risk gate.
Use the platform as a decision process.
The goal is not to copy one level. The goal is to learn how auction value, retail behavior, liquidity pressure, delta, and risk rules combine into a trade idea.