Retail Positioning Intelligence

Synthetic Liquidity Map: Reading Retail Positioning Through Auction Theory

The Synthetic Liquidity Map is a public explanation of how aggregated retail positioning can be organized into auction-market context. It does not show live protected data on this page. It explains the framework: where traders are waiting, where they are trapped, and how those zones can confirm or challenge VAH, POC, VAL, and session structure.

Discipline Notice

Past performance does not guarantee future results. Research output, not investment advice. Retail positioning is approximate and should be used as confluence with auction structure, never as a stand-alone signal.

Schematic heatmap

Eight quadrants around current price

Above price, the map separates passive supply, buy-stop triggers, winning shorts, and trapped longs. Below price, it separates passive demand, sell-stop triggers, trapped shorts, and winning longs.

current price
Q1
Sell Limits
Q2
Buy Stops
Q5
Profit Sellers
Q6
Loss Buyers
Q3
Sell Stops
Q4
Buy Limits
Q7
Loss Sellers
Q8
Profit Buyers
Two heatmap views

Directional pressure first, anatomy when you need the breakdown.

The protected product has two ways to inspect the same positioning snapshot. Directional view simplifies the pressure. Anatomy view shows which type of inventory is creating it.

Directional view

The default read compresses the positioning grid into bullish and bearish pressure at each price. It is meant for fast context, not a stand-alone signal.

Synthetic Liquidity Map directional view showing bullish and bearish liquidity by EURUSD price level.

Anatomy view

The advanced read separates passive limits, stop cascades, trapped positions, and profit-side inventory so the pressure can be inspected more carefully.

Synthetic Liquidity Map anatomy view showing passive, aggressive, trapped, and winning positioning columns by EURUSD price level.

What retail order and position data can reveal

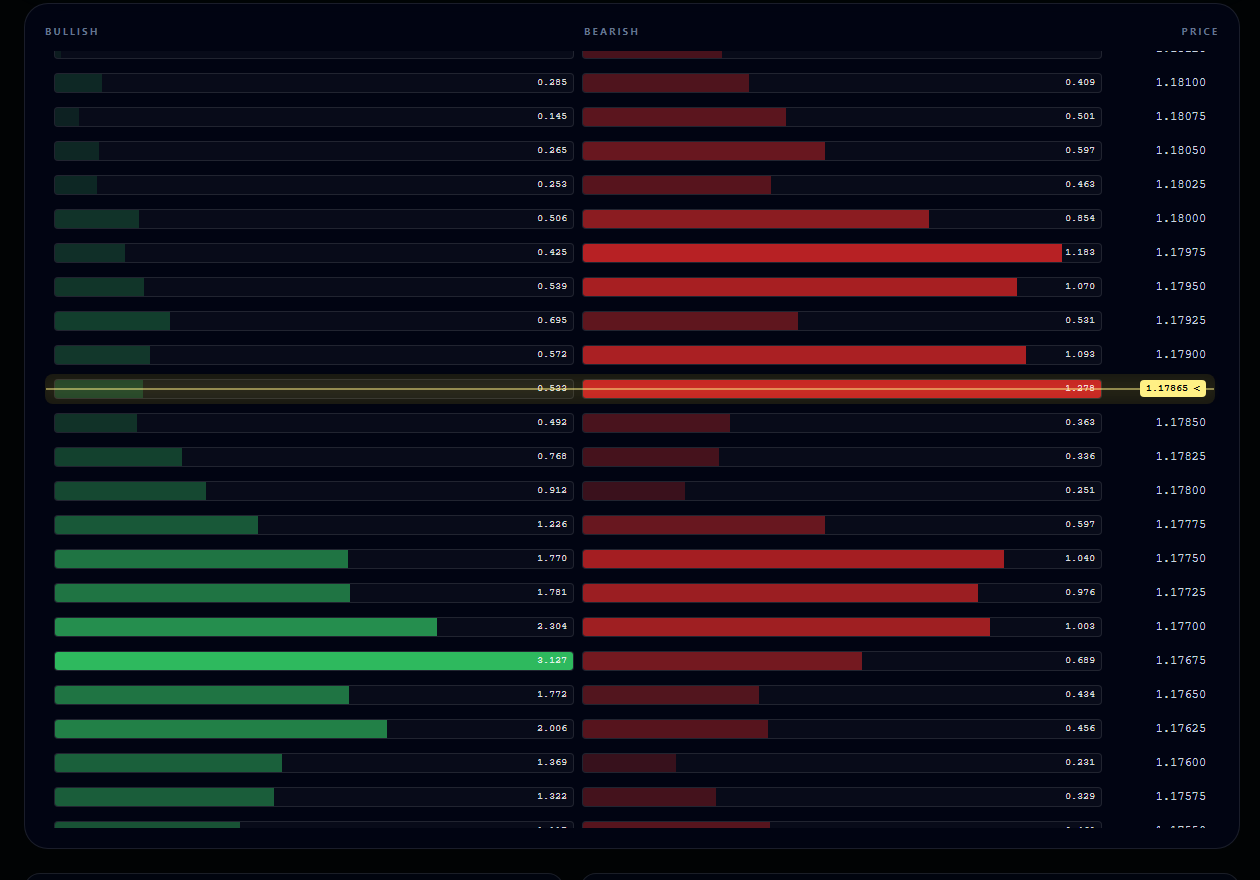
Spot forex does not trade on one centralized exchange, so no retail platform has the complete market. Still, broker-aggregated retail positioning can be useful when it is treated honestly. It can show where sampled traders are already long or short, where pending orders are stacked, and where a group of traders may be vulnerable if price accepts against them.

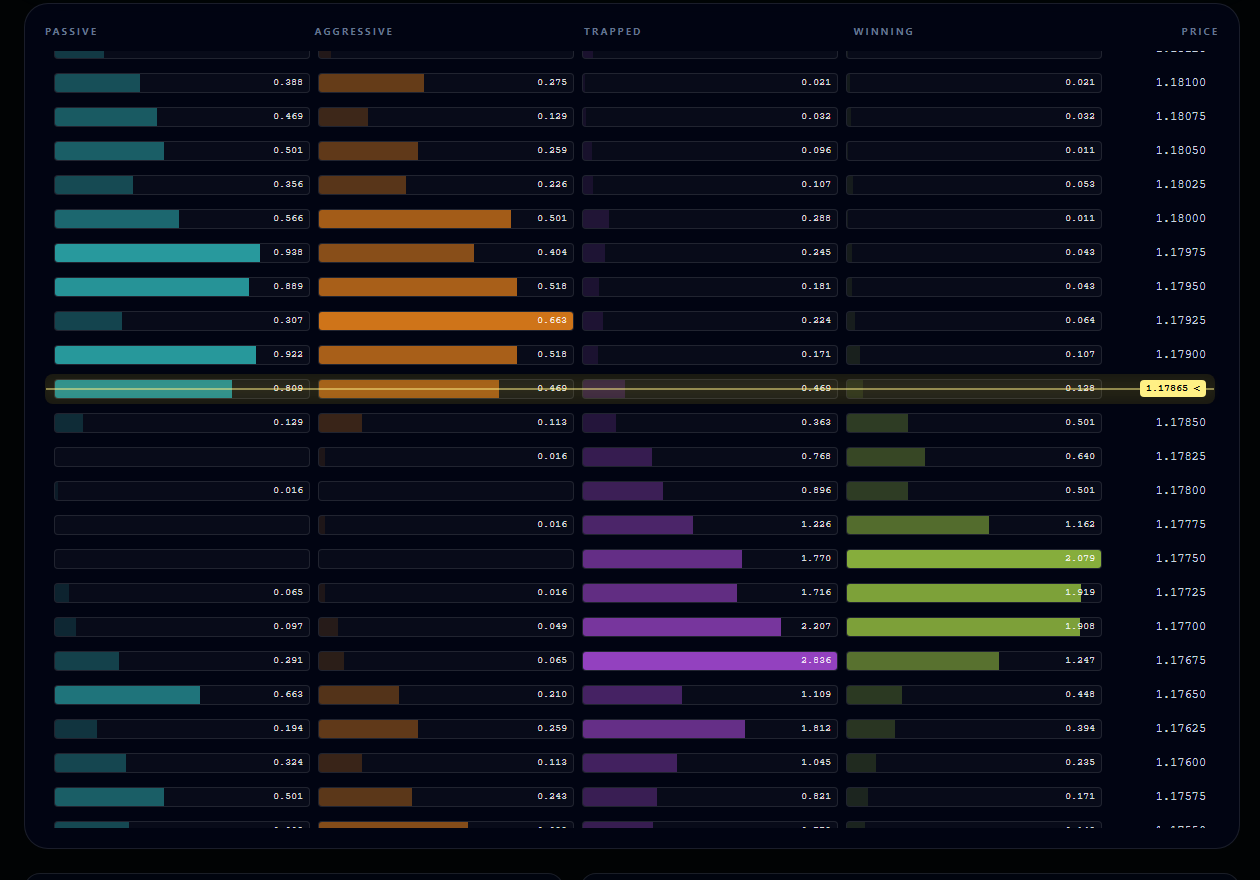
The map is not trying to become a complete order book. It is a structured context layer. If a large percentage of sampled retail traders are short while EURUSD is holding above prior VAH, the market may have squeeze pressure. If buy limits cluster around prior VAL while the day is balanced, the zone may absorb a first test. If sell stops cluster below a weak low and the auction starts accepting lower value, downside acceleration becomes easier to understand.

The important word is context. Retail positioning becomes more meaningful when the auction agrees with it. A wall away from value, with no session participation and no acceptance, is easy to overread. A wall that sits directly on a known value reference, during the right session, after the market has already shown rejection or acceptance, is more useful. Trading Analytica organizes the map so that users can see those relationships without pretending a single data source predicts the next candle.

Passive vs aggressive liquidity

Passive liquidity is waiting. Limits are orders placed at a price in advance, so they can absorb a move when price reaches them. A buy-limit stack near prior VAL can act like passive demand. A sell-limit stack near prior VAH can act like passive supply. Passive walls are zones of possible response, not hard promises.

Aggressive liquidity triggers when price trades into it. Stops are not waiting to negotiate; they become market participation. Buy stops above price can accelerate a rally. Sell stops below price can accelerate a breakdown. This distinction matters because a limit wall can slow price, while a stop cluster can speed it up once the trigger zone is reached.

Trapped positions are a third layer. A trader already short below current price can become a forced buyer if the market keeps accepting higher value. A trader already long above current price can become a forced seller if the market keeps accepting lower value. This is where retail positioning becomes most useful: not because it knows the future, but because it identifies where pain may increase if the auction keeps moving against the trapped side.

The 8-quadrant framework

Q1

Sell Limits

Passive supply above price

Sell limits above price represent traders waiting to sell into a rally. In auction terms, this can behave like a resistance wall because it absorbs upward movement instead of accelerating it. The wall is not a precise pip-level prediction; it is a zone where passive supply may appear.

Q2

Buy Stops

Aggressive trigger orders above

Buy stops above price are trigger orders. If price trades into them, they can accelerate a move because resting orders become market participation. In a clean acceptance environment, buy stops can help continuation; in a rejected probe, they can become fuel that is quickly exhausted.

Q3

Sell Stops

Aggressive trigger orders below

Sell stops below price are bearish trigger orders. When a prior VAL, session low, or weak auction boundary gives way, clustered sell stops can accelerate a downside campaign. The map treats them as cascade fuel, not as a fixed destination.

Q4

Buy Limits

Passive demand below price

Buy limits below price represent traders waiting to buy a pullback. If they align with prior value, POC, or a defended session reference, they can help absorption. If the auction is accepting lower value, the same wall can break and become evidence that passive demand was not enough.

Q5

Profit Sellers

Shorts already winning

Profit sellers above price are short positions already in profit relative to the current market. They may cover voluntarily, but they do not have the same urgency as a stop. That is why profit-side positioning is treated as latent context rather than forced flow.

Q6

Loss Buyers

Longs trapped above price

Loss buyers above price are long positions under pressure. If price remains below their entry area, they can become capitulation fuel. In AMT language, this matters most when the auction keeps accepting below them instead of rotating back to repair.

Q7

Loss Sellers

Shorts trapped below price

Loss sellers below price are short positions trapped while the market trades above them. If EURUSD holds higher value, those shorts can cover and support a squeeze. This is one of the cleanest examples of positioning becoming useful only when aligned with auction acceptance.

Q8

Profit Buyers

Longs already winning

Profit buyers below price are long positions already in profit. They may take profit into strength or during a pullback, but the action is voluntary. The map therefore treats this as softer pressure than stops or trapped loss positions.

Confluence with value

When 70% or more of sampled retail positioning leans one way and EURUSD is holding a prior VAH, VAL, or POC reference against that crowd, the map becomes useful confluence. It does not replace the auction read; it helps explain who may be under pressure.

Squeeze setup context

If shorts are trapped below price and EURUSD continues to accept above the old value area, forced covering can support continuation. The map helps identify the pressure zone, while the daily auction bias decides whether continuation actually fits the session.

Capitulation risk

If longs are trapped above price and the auction is accepting lower value, bounce attempts can become repair rather than fresh upside. That is a warning to avoid treating every green candle as a clean long idea.

How the directional view is built

The internal heatmap simplifies the eight quadrants into a directional read so the operator can see pressure quickly. Bullish pressure comes from buy stops above price, buy limits below price, trapped shorts below price, and a smaller weighted contribution from shorts already in profit. Bearish pressure comes from sell limits above price, sell stops below price, trapped longs above price, and a smaller weighted contribution from longs already in profit.

The reason profit positions receive a lighter weight is behavioral. A trader in profit can choose to close, trail, wait, or scale out. A trader trapped on the wrong side has less freedom if the market keeps accepting against them. Stops and loss positions therefore carry a more urgent interpretation than voluntary profit-taking. This is still a model of behavior, not certainty, so the page keeps the language descriptive.

The default view is meant to answer a simple question: where is pressure stacked relative to current price? A strong green zone below price can mean passive demand, trapped shorts, or both. A strong red zone above price can mean passive supply, trapped longs, or both. The advanced anatomy view separates those ingredients so the operator can decide whether the pressure is likely to absorb a move, accelerate a move, or simply describe stale positioning.

Example reads without turning the map into a signal

When more than 70% of sampled retail positioning is short and price is holding above prior VAH, squeeze probability may rise because the trapped side is under pressure. That does not mean buy blindly. It means a bullish auction read has stronger supporting context than it would have in neutral positioning.

When sell stops cluster below prior VAL and the session starts accepting below value, a downside cascade is easier to understand. The stops supply acceleration. The auction structure supplies the reason the market is allowed to keep exploring lower prices. Without acceptance, the same stop run can fail and rotate back.

When buy limits stack at prior VAL during a balanced day, the first test may absorb and rotate. The correct read is not that the wall must hold. The correct read is that passive demand is visible at a known value boundary, so the first response deserves attention. If repeated tests weaken the wall, the read changes.

When trapped longs sit above price while the market cannot reclaim POC, a bounce may be only repair. The map reminds the operator that participants above are still under pressure. A clean bullish thesis needs the auction to repair through value, not simply print one strong candle.

How it pairs with the daily auction narrative

The daily narrative starts with auction structure: where price opened, whether it accepted prior value, how the sessions behaved, and whether the day is trending, balancing, repairing, or migrating. The Synthetic Liquidity Map comes after that read. It asks whether sampled retail positioning helps explain the same structure or whether it introduces tension that should make the operator more cautious.

For example, a bullish value-acceptance day with heavy trapped shorts below price has cleaner contextual support than a bullish day where retail is already aggressively long and sitting in profit. In the first case, a squeeze can help continuation. In the second case, the move may already be crowded. The auction level is still primary, but the positioning layer changes how confidently the story should be interpreted.

The opposite is also important. If the daily auction bias points lower while the map shows a heavy buy-limit wall at prior VAL, the wall does not cancel the bearish read. It marks the zone where the bearish read must prove itself. If price breaks and accepts below that demand, the wall becomes evidence of failed absorption. If price rejects and rotates higher, the wall helped identify where the auction changed character.

This is the reason the public page uses educational language instead of live levels. The goal is to teach the reader how to think about inventory, pressure, and value-area context before they ever see the protected dashboard. A user who understands the framework is less likely to overreact to one bright heatmap cell and more likely to ask the right AMT question: is the auction accepting, rejecting, repairing, or migrating?

The best use case is review, not impulse. The map can explain why a level responded, why a squeeze extended, or why a breakdown accelerated after stops were triggered. That kind of explanation is valuable only when it is tied back to session structure and written down before the next decision.

Limitations and discipline

Broker-aggregated retail positioning is a sample, not the whole EURUSD market. It can be stale, incomplete, and imprecise around exact price levels. The map should be read as zones of pressure and inventory, not as a tick-perfect institutional order book.

Extremes matter more than moderate readings. A 52/48 split usually says little. A 70/30 or stronger imbalance near a known auction boundary can be informative, especially when the trapped side is clearly losing and the session is accepting against them.

The final discipline rule is simple: confluence only. The Synthetic Liquidity Map can confirm, challenge, or explain an AMT read. It should never replace VAH, POC, VAL, session structure, risk, or the formal validation process. Past performance does not guarantee future results. Research output, not investment advice.

Continue the research path