Retail Behavior Around Liquidity Data: Why EURUSD Runs Differently From One Day To The Next
A practical read of how retail positioning, liquidity clusters, auction value, and volatility changed across the May 20-22 EURUSD sequence.
The main lesson
Markets do not repeat because a level exists. Markets repeat when the participants behind that level are still trapped, still defending, or still forced to rebalance.
From May 20 to May 22, EURUSD did not move randomly. It moved through different inventory states. On Wednesday, the move was violent and directional. On Thursday, the same upper zone kept rejecting retests. On Friday, the market still respected levels, but the pace became more two-sided because liquidity and delta were no longer aligned in the same clean way.
Wednesday was the clean trap
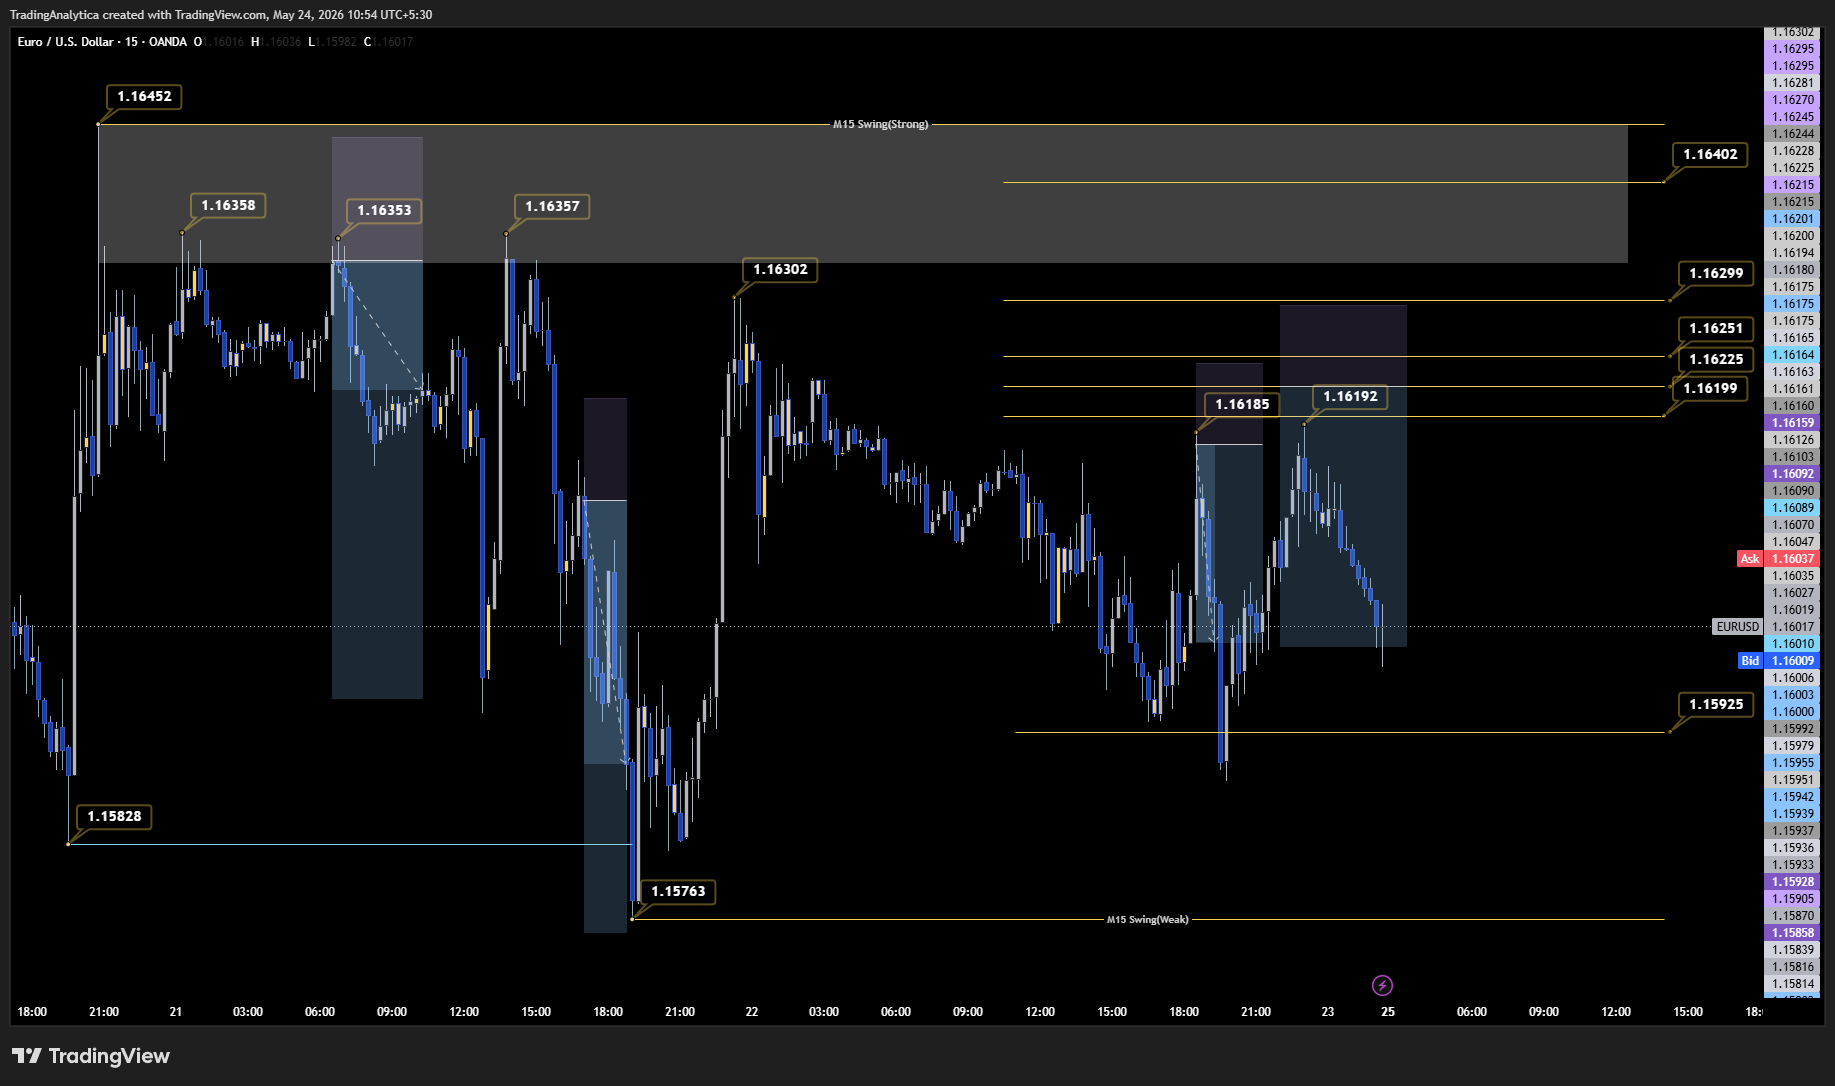
The New York overlap leg ran from roughly 1.15828 to 1.16452. That is more than 60 pips from low to high in a short window.
The important part was not only the rally. The important part was what happened after the rally reached the upper zone. Price stopped, rejected, and later kept respecting that area. That gave the system a reason to treat the upper zone as a defended supply area instead of a random high.
- Price expanded quickly from the overlap low.
- Retail stop activity likely helped fuel the upward burst.
- The upper zone later behaved like supply rather than clean breakout acceptance.
- Auction value failed to accept higher after the squeeze.
Thursday was the retest day
On Thursday, price tapped the upper region again: late New York near 1.16358, Asia near 1.16353, and London near 1.16357. Each test rejected.
This is why limit orders made sense there. The plan was not to chase the falling market. The plan was to wait for price to return to a known supply shelf and then see whether the same trapped inventory still defended the zone.
- The same upper band rejected multiple retests.
- The system ladder looked for sell limits above current price, not market sells after the move had already happened.
- The best entries came from retests into the prior rejection zone.
Friday was a different market pace
Friday still respected structure, but it was not the same quality as Wednesday or Thursday. Price rotated from 1.16302 down to 1.15934, bounced to 1.16185, rejected to 1.15883, then rebounded again to 1.16192 before closing near 1.15982.
That is a two-sided market. The levels still mattered, but the market was now rotating between supply and support instead of delivering one clean directional campaign.
- Cumulative pressure turned positive at points, warning that shorts could be squeezed.
- Liquidity shelves shifted instead of staying fixed.
- The correct risk changed from full conviction to probe sizing.
- A level can still be valid while the trade quality is lower.
How retail behaved
Retail behavior was most useful when it changed while price moved. If price rallied but retail long percentage did not chase the move, that suggested the rally was not simple retail FOMO. If price dropped while retail longs increased, that suggested dip-buying and trap-loading.
The mistake is to read one retail percentage in isolation. The better question is: what did retail do while price moved into or away from liquidity?
- Retail buying into a falling market can create future sell pressure.
- Retail shorts adding into a rally can create buy-stop fuel above price.
- Retail becoming balanced can reduce the quality of contrarian setups.
The practical rule
A liquidity level alone is not enough. A retail positioning signal alone is not enough. A volume profile level alone is not enough.
The better trade idea comes when the auction, liquidity shelf, retail behavior, delta, and price action all describe the same story. When those layers disagree, the right move is smaller size, deeper entries, or no trade.
Use the platform as a decision process.
The goal is not to copy one level. The goal is to learn how auction value, retail behavior, liquidity pressure, delta, and risk rules combine into a trade idea.