Back to Home
Recorded Case Study

MAY 20-22 EURUSD: LIQUIDITY TRAP & PLANNED ENTRIES

A detailed review of the three-day EURUSD sequence we studied live: the system mapped auction value, retail behavior, liquidity shelves, and shadow alerts, then the operator waited for retests instead of chasing lows.

What This Page Is

This is a trade-research review, not financial advice. We review historical sequences to demonstrate how the system builds a trade thesis using evidence layers like auction value, cumulative delta, and liquidity positioning. Past sequences do not guarantee future outcomes.

TradingView screenshot of May 20-22 EURUSD case study
Trading Analytica EvidenceEURUSD 15m • Recorded Case Study

WHAT THE SYSTEM WAS REALLY SAYING

The edge was not "sell because price is falling." The edge was waiting for price to return into areas where failed acceptance, trapped longs, and passive sell-side pressure were already visible.

May 20 reference leg
1.15828 -> 1.16452

NY overlap squeeze created the upper reference zone. Backend Massive candles showed the same leg at roughly 63 pips.

May 21 retest zone
1.1635x rejected

Late NY and Asia both tapped the same neighborhood and failed to build higher acceptance.

May 22 migrated shelf
1.16200-1.16250

Overhead trapped-long liquidity migrated lower as value accepted beneath the prior range.

Retail behavior
57-60% long

Retail kept leaning long while price accepted lower, creating the trap-loading condition.

Volume + Synthetic Pressure

THE MISSING TOP CONFIRMATION

May 20 20:45-20:50 IST: volume expanded after the high while pressure stopped confirming upside.

Backend 1-minute candles plus quote-derived cumulative pressure, queried for 2026-05-20 13:00-16:30 UTC and the 15:10-15:30 UTC top window.

Squeeze bucket
20:40-20:50 IST / 15:10-15:20 UTC
2224 volume / +29.93 pressure

Price expanded from 1.16141 to 1.16442 high, then closed the bucket at 1.16326.

Rejection bucket
20:50-21:00 IST / 15:20-15:30 UTC
2821 volume / -3.86 pressure

This was the highest 10-minute volume bucket in the queried overlap window and closed lower at 1.16247.

Volume expansion
After the high
1.27x higher

The rejection bucket carried 27% more volume than the squeeze bucket, but price moved down instead of extending higher.

Pressure shift
Squeeze -> rejection
+29.93 -> -3.86

Quote-derived pressure flipped from clear upside impulse to flat/negative while price rejected.

Time
Price
Volume
Pressure
System Read
Time
20:45 IST / 15:15 UTC
Price
O 1.16142 / H 1.16393 / L 1.16130 / C 1.16363
Volume
200
Pressure
+24.09
System Read

Fast upside expansion. Buyers/stop-flow had enough pressure to launch price into the upper reference zone.

Time
20:46 IST / 15:16 UTC
Price
O 1.16355 / H 1.16440 / L 1.16337 / C 1.16401
Volume
142
Pressure
+7.89
System Read

Final push into the high zone. Upside pressure continued, but volume was not exceptional.

Time
20:47-20:49 IST / 15:17-15:19 UTC
Price
High 1.16442 -> close 1.16326
Volume
823
Pressure
-2.60
System Read

Price failed immediately after the high. Pressure stopped confirming the upside and turned slightly negative.

Time
20:50-20:59 IST / 15:20-15:29 UTC
Price
O 1.16329 / H 1.16360 / L 1.16230 / C 1.16247
Volume
2821
Pressure
-3.86
System Read

Highest 10-minute volume of the queried overlap window printed during rejection, not continuation.

Combined Read

The combined read is sell-side absorption / failed continuation: the market had positive pressure into the high, but the next heavier-volume bucket could not extend higher and instead closed lower. That is why the 1.1644x area became a reference zone for later retest planning.

THE THREE-DAY TIMELINE

Wednesday, May 20

Reference Zone

On May 20, the system marked a repeated upper rejection zone during the London/New York overlap. Price squeezed into that zone, but the auction failed to accept higher. The rejection and pressure behavior gave us a sell-side reference level to monitor, not a blind short signal.

Thursday, May 21

Retest Work

On May 21, the important lesson was not "short every rally." The lesson was to watch whether retests were being accepted or rejected. When the system showed overhead liquidity and auction rejection, the planned sell-limit areas had a clear thesis and a clear invalidation.

Friday, May 22

Lower Value And Probe Risk

On May 22, the system showed a different market character. It was not the same clean top-down sell as Wednesday. Value was migrating lower, but cumulative pressure and headline risk made full-size deployment less attractive. The better lesson for users is sizing: a valid idea can still deserve probe risk instead of full risk.

Actual Executed Trades

THE TRADES PLACED BY THE OPERATOR

These rows are taken from Munish's MT5 history screenshots. They show the difference between a system context and a real trade: the system gives the map, but the operator still chooses entry, size, target, protection, and exit.

May 21 Asia retest short
Core target hit after price rejected the 1.1635x retest zone.
Entry
1.16334
2026.05.21 04:09:16
Exit
1.15950
2026.05.21 10:25:53
Size / Target
3.0 lots
planned 1.15950
Visible P&L
+$1,152
May 21 protected remainder
Protected/scratch row. The screenshot shows the remaining size was not left exposed after the first target sequence.
Entry
1.16334
2026.05.21 04:09:16
Exit
1.16333
2026.05.21 11:16:00
Size / Target
2.0 lots
planned 1.15850
Visible P&L
+$2
May 21 lower retest short
Retest of the lower migrated shelf. This was the manual execution version of the system's retest logic.
Entry
1.16126
2026.05.21 14:20:24
Exit
1.15949
2026.05.21 15:17:00
Size / Target
3.0 lots
planned 1.15950
Visible P&L
+$531
May 21 managed runner
Runner was managed before the deeper target. The important lesson is execution discipline, not forcing the final target.
Entry
1.16126
2026.05.21 14:20:24
Exit
1.15999
2026.05.21 16:54:37
Size / Target
3.0 lots
planned 1.15753
Visible P&L
+$381
MT5 history screenshot showing May 21 EURUSD short trades
Trading Analytica EvidenceMAY 21 EXECUTION ROWS - 1.16334 AND 1.16126
MT5 history screenshot showing protected and target-hit May 21 EURUSD short trades
Trading Analytica EvidenceMAY 21 TARGET AND PROTECTED ROWS

Public-copy rule: this section should be presented as a recorded operator review, not as a promise that future setups will behave the same way. The important proof is the process: map context, wait for retest, define invalidation, manage exits.

Research Notebook

THE DATA BEHIND THE LIMIT PLANS

This is the detailed swing-by-swing evidence chain from the internal study notes. It shows why the research process moved from the May 20 upper reference zone toward lower retest shelves around 1.16225 and 1.16250.

Data Quality And Profile Note

Retail-feed snapshots from May 20 07:54 IST to May 21 03:41 IST are flagged as degraded because the data subscription expired before renewal. Numbers from that window are shown as displayed system context, not clean standalone proof.

The value-profile reads below are approximate candle-volume profiles from Massive 1-minute candles. They are useful for auction context, but they are not true tick-by-price volume profile.

Swing 1

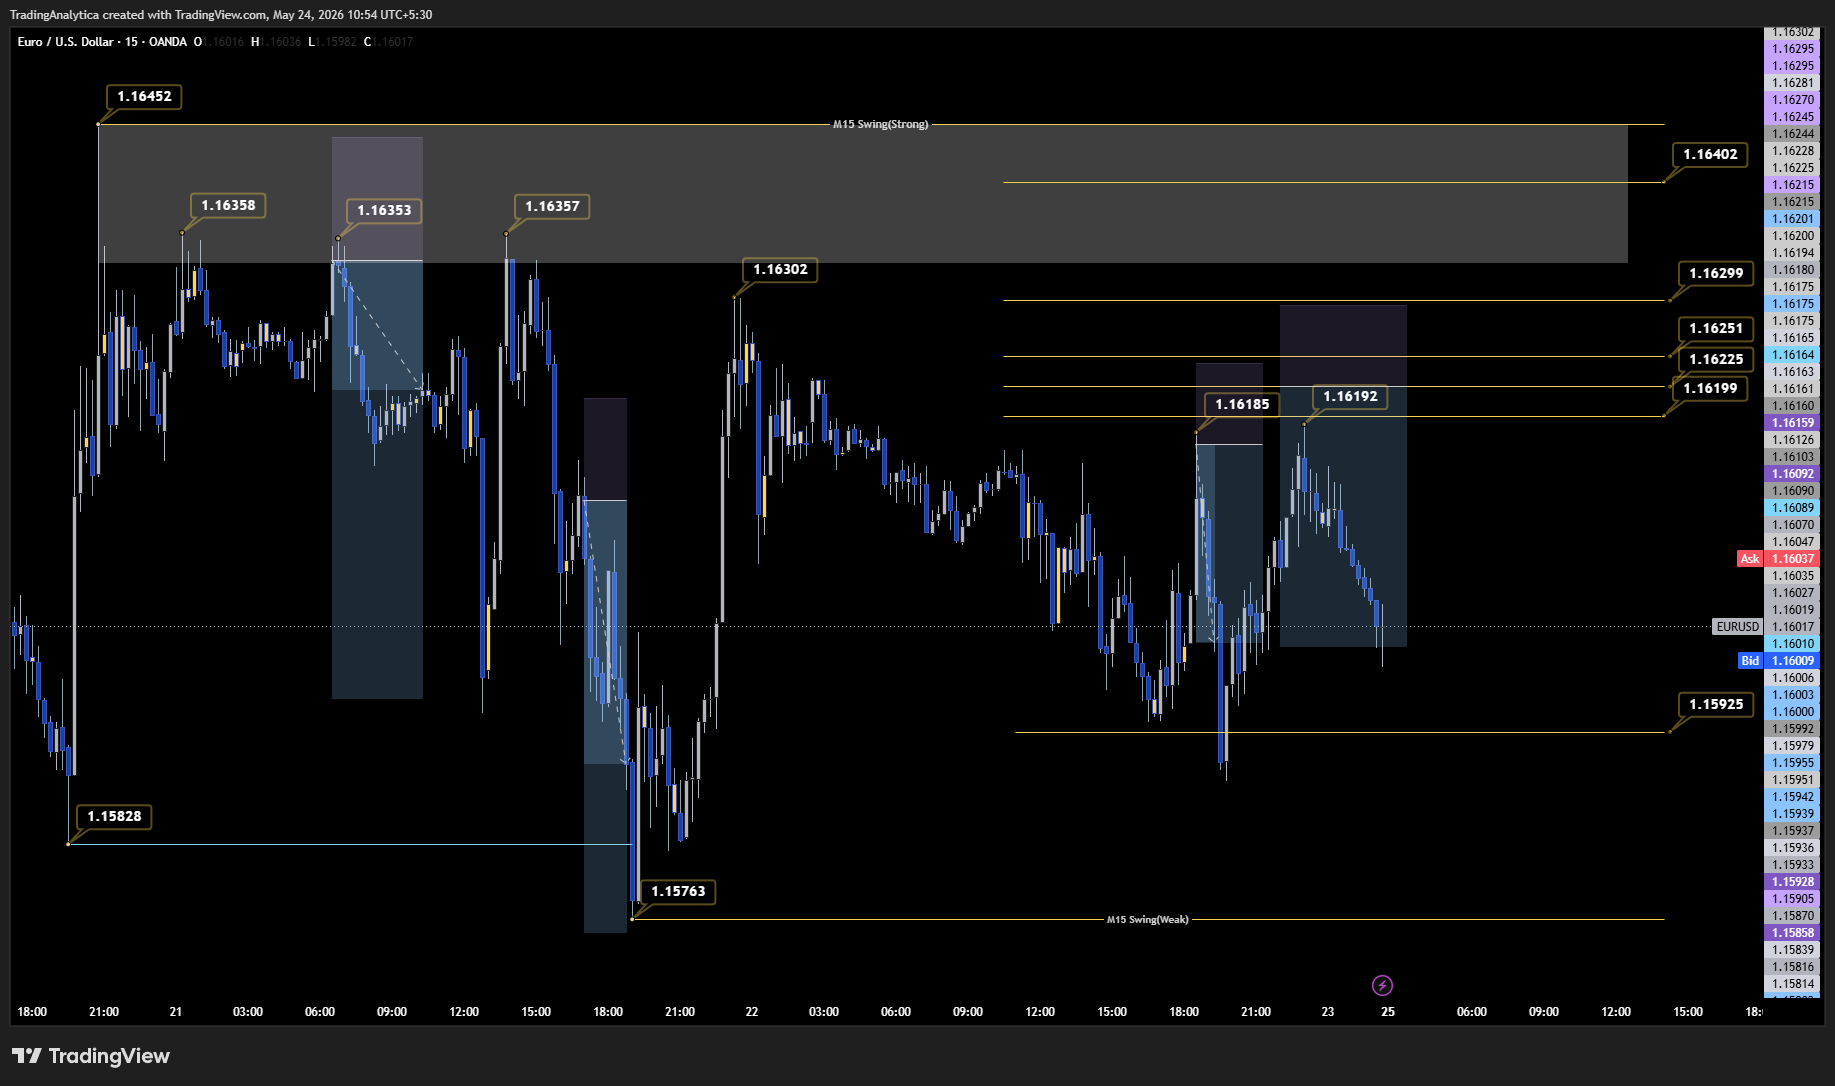
May 21 00:15 IST - late NY retest near 1.16358

Evidence + Interpretation
Price Action

O 1.16280 / H 1.16355 / L 1.16260 / C 1.16321

Auction / Profile

Approx profile: VAL 1.16300 / POC 1.16320 / VAH 1.16320

Retail Behavior

Retail-feed snapshot 00:11 IST: price 1.16322, retail 67.4% long / 32.6% short. This row is inside the degraded retail-feed window, so it is supporting context only.

Liquidity Shelves

Overhead shelves: 1.16450 combo 2.29, 1.16500 combo 1.81, 1.16425 combo 1.81.

System Read

Price had not accepted above the May 20 high zone. The useful evidence was the repeated rejection below the upper reference area.

Swing 2

May 21 06:30 IST - Asia retest near 1.16353

Evidence + Interpretation
Price Action

O 1.16245 / H 1.16360 / L 1.16210 / C 1.16313

Auction / Profile

Approx profile: VAL 1.16250 / POC 1.16250 / VAH 1.16320

Retail Behavior

Retail-feed snapshot 06:31 IST: price 1.16294, retail 55.9% long / 44.1% short.

Liquidity Shelves

Overhead shelves: 1.16450 combo 1.74, 1.16325 combo 1.64, 1.16350 combo 1.61. Lower shelves: 1.15950 combo 2.24, 1.15900 combo 2.18, 1.16000 combo 2.12.

System Read

This was the clean post-renewal retest. The sell idea had structure because price returned into an overhead shelf and failed again.

Swing 3

May 21 06:30 -> 12:45 IST - Asia/London drop

Evidence + Interpretation
Price Action

1.16353 -> 1.15942 on the user chart. Massive window net -18.3p, range 27.0p.

Auction / Profile

Approx profile: VAL 1.16180 / POC 1.16200 / VAH 1.16250. Close below VAL.

Retail Behavior

Retail-feed snapshot 12:51 IST: price 1.16017, retail 54.6% long / 45.4% short.

Liquidity Shelves

Overhead trapped-long shelves migrated lower: 1.16200 combo 2.67, 1.16225 combo 2.66, 1.16250 combo 2.37.

System Read

This is where the important resistance began migrating lower. The market was no longer only about 1.1644x; 1.1620-1.1625 became the retest zone.

Swing 4

May 21 12:45 -> 13:45 IST - London V rally

Evidence + Interpretation
Price Action

1.15942 -> 1.16357 on the user chart. Massive range 40.5p.

Auction / Profile

Approx profile: VAL 1.15980 / POC 1.16020 / VAH 1.16080. Close above VAH.

Retail Behavior

Retail-feed snapshot 13:51 IST: price 1.16247, retail 54.1% long / 45.9% short.

Liquidity Shelves

Overhead shelves: 1.16250 combo 2.05, 1.16450 combo 1.54, 1.16325 combo 1.46. Lower shelves: 1.15950 combo 2.43, 1.15900 combo 2.36.

System Read

The V rally was real volatility. Because it closed above short-term value, the correct response was caution: wait for rejection, do not blindly short the impulse.

Swing 5

May 21 13:45 -> 19:00 IST - London/NY selloff

Evidence + Interpretation
Price Action

1.16357 -> 1.15763 on the user chart. Massive net -37.5p, range 49.2p.

Auction / Profile

Approx profile: VAL 1.16050 / POC 1.16280 / VAH 1.16320. Close below VAL.

Retail Behavior

Retail-feed snapshot 18:51 IST: price 1.15880, retail 54.4% long / 45.6% short.

Liquidity Shelves

Overhead shelves: 1.16225 combo 2.45, 1.16250 combo 2.24, 1.16200 combo 2.08. Lower shelf: 1.15875 combo 2.22.

System Read

This was strong lower-value confirmation. Price rejected the upper distribution and moved away from it.

Swing 6

May 21 19:00 -> 23:15 IST - NY recovery

Evidence + Interpretation
Price Action

1.15763 -> 1.16302 on the user chart. Massive net +30.3p, range 49.1p.

Auction / Profile

Approx profile: VAL 1.15850 / POC 1.15880 / VAH 1.15950. Close above VAH.

Retail Behavior

Retail-feed snapshot 23:11 IST: price 1.16217, retail 58.6% long / 41.4% short.

Liquidity Shelves

Overhead shelves: 1.16225 combo 2.70, 1.16250 combo 2.56, 1.16300 combo 2.02.

System Read

Recovery from lows was strong, but it ran straight into the same overhead trapped-long area while retail returned to the trap-loading band.

Swing 7

May 22 00:00 -> 16:30 IST - London selloff / lower value acceptance

Evidence + Interpretation
Price Action

1.16302 -> 1.15934 on the user chart. Massive net -30.4p, range 34.7p.

Auction / Profile

Approx profile: VAL 1.16050 / POC 1.16120 / VAH 1.16180. Close below VAL.

Retail Behavior

Retail-feed snapshot 16:31 IST: price 1.15959, retail 57.5% long / 42.5% short.

Liquidity Shelves

Overhead shelves: 1.16225 combo 2.82, 1.16250 combo 2.79, 1.16200 combo 2.37. Lower shelves: 1.15925 combo 2.75, 1.15900 combo 2.17.

System Read

The system saw lower value acceptance. The shadow sell context was right, but the better execution was to wait for retest limits instead of chasing the low.

Swing 8

May 22 16:30 -> 18:30 IST - NY bounce into retest area

Evidence + Interpretation
Price Action

1.15934 -> 1.16185 on the user chart.

Auction / Profile

Approx profile: VAL 1.15950 / POC 1.15950 / VAH 1.16000. Close above VAH.

Retail Behavior

Retail-feed snapshot 18:31 IST: price 1.16057, retail 58.6% long / 41.4% short.

Liquidity Shelves

Overhead shelves: 1.16225 combo 2.80, 1.16250 combo 2.78, 1.16200 combo 2.38. Lower shelf: 1.15925 combo 3.02.

System Read

Retail remained in the trap-loading band. The bounce gave a location to sell if it failed, rather than an invitation to chase the earlier shadow alert.

Swing 9

May 22 18:30 -> 19:45 IST - NY rejection drop

Evidence + Interpretation
Price Action

1.16185 -> 1.15883 on the user chart. Massive range 30.4p.

Auction / Profile

Approx profile: VAL 1.16020 / POC 1.16050 / VAH 1.16150. Close below VAL.

Retail Behavior

Retail-feed snapshot 19:51 IST: price 1.15914, retail 59.8% long / 40.2% short.

Liquidity Shelves

Overhead shelves: 1.16225 combo 2.85, 1.16250 combo 2.80, 1.16200 combo 2.50.

System Read

This was the cleanest confirmation that the 1.16185 retest failed. Price dropped while retail kept leaning long.

Swing 10

May 22 19:45 -> 23:00 IST - late NY rebound

Evidence + Interpretation
Price Action

1.15883 -> 1.16192 on the user chart. Massive net +28.4p.

Auction / Profile

Approx profile: VAL 1.15980 / POC 1.16000 / VAH 1.16100. Close above VAH.

Retail Behavior

Retail-feed snapshot 22:51 IST: price 1.16115, retail 58.2% long / 41.8% short.

Liquidity Shelves

Overhead shelves: 1.16250 combo 2.81, 1.16200 combo 2.58, 1.16225 combo 2.48.

System Read

The rebound proved the market was two-sided, but the same 1.16200-1.16250 supply shelf remained visible.

Swing 11

May 22 23:00 -> Friday close

Evidence + Interpretation
Price Action

1.16192 -> 1.15982 on the user chart.

Auction / Profile

Approx profile: VAL 1.16120 / POC 1.16120 / VAH 1.16150. Close below VAL.

Retail Behavior

Retail-feed snapshot 23:51 IST: price 1.16111, retail 56.9% long / 43.1% short.

Liquidity Shelves

Overhead shelves: 1.16250 combo 2.77, 1.16200 combo 2.68, 1.16225 combo 2.50.

System Read

Friday closed weak relative to the late NY profile, with overhead trapped-long supply still visible.

SHADOW ALERTS WERE CONTEXT, NOT BLIND ENTRIES

The alerts helped define the bearish context. The execution improvement was waiting for retests into overhead trapped-long shelves.

May 22 16:30 IST

VA Acceptance Breakout

Entry 1.15973 / SL 1.16083

Targets: 1.15683 / 1.15393

Evidence: Prior VA 1.16030 / 1.16190 / 1.16320, width 29.0p

Review: Stopped, -1.0R. Directional context was useful, but execution was too aggressive near the low.

May 22 17:31 IST

Liquidity Trap Cascade

Entry 1.15958 / SL 1.16085

Targets: 1.15769 / 1.15579

Evidence: Retail 58.3% long, long loss 95.5%, value migration lower, cascade near 1.15750.

Review: Research/shadow only. Better manual execution was to wait for retest.

May 22 18:31 IST

Liquidity Trap Cascade

Entry 1.16057 / SL 1.16245

Targets: 1.15774 / 1.15491

Evidence: Retail 58.6% long, profile d-shape, value migration lower, cascade near 1.15750.

Review: Research/shadow only. It confirmed context but did not replace operator entry planning.

WHY THE RESEARCH LADDER LEVELS SHIFTED LOWER

Once value accepted lower, the important sell zones moved from the original May 20 high toward the new overhead trapped-long shelves.

May 22 12:31 IST

Plan 18 - Trap-Loading Bearish

Price 1.16060
System-Generated Research Levels
1.16225 / 1.16275 / 1.16325

The research ladder proposed higher retests because overhead trapped-long/sell-limit shelves were visible above current price. These were proposed levels, not broker-executed orders.

May 23 02:31 IST

Plan 19 - Trap-Loading Bearish

Price 1.16057
System-Generated Research Levels
1.16100 / 1.16225 / 1.16275

The research ladder migrated the first proposed entry lower after value accepted lower, but kept 1.16225/1.16275 as deeper shelf retests. The operator still controlled execution and risk.

Plain-English Conclusion

The system was saying: do not short just because price is falling. Wait for price to bounce into the area where trapped longs and passive sellers are waiting. If that bounce rejects, then the short has structure, a stop location, and a target.

EVIDENCE LAYERS

A thesis is only as strong as the evidence supporting it across multiple independent metrics. This case study uses each layer as context, not as a standalone signal.

Price Action

  • Session high/low boundaries established.
  • London/New York overlap behavior monitored.
  • Repeated rejection zones identified.
  • Retests aligned cleanly with planned limit orders.

Auction Model

  • Monitored Prior VAH/POC/VAL.
  • Tracked current session value migration.
  • Assessed acceptance below/above value areas.
  • Evaluated profile shape behavior.

Retail Positioning

  • Tracked shifting Long/Short percentages.
  • Identified clusters of longs and shorts held in loss.
  • Mapped trapped cluster levels.
  • Applied quality filters to exclude stale data windows.

Liquidity Anatomy

  • Located heavy sell-limit clusters above price.
  • Located buy-limit clusters below price.
  • Identified trapped long / trapped short shelves.
  • Monitored absorption of important clusters.

Cumulative Delta & Pressure

  • Compared price movement against synthetic pressure.
  • Checked if rejection happened with positive or negative delta.
  • Evidence was consistent with strong sell-side absorption.
  • Monitored pressure divergence at the highs.

Shadow Alerts

  • VA Acceptance Breakout alerts triggered.
  • Liquidity Trap Cascade alerts fired.
  • Shadow validation provided early warning before execution.
  • Alert status maintained as 'research' for ongoing calibration.

Operator Plan

  • Limit Levels1.16334 first retest, then 1.16126 lower retest.
  • Risk CapDefined before entry, with rows managed as targets or protection.
  • InvalidationAcceptance back above the retest shelf.

The Result

  • ExecutionVisible MT5 rows show entries at 1.16334 and 1.16126.
  • OutcomeVisible realized result: +$2,066 across the four screenshot rows.
  • ReviewThe plan worked because it waited for the market to come back into structure rather than chasing the lows. The best public lesson is the process: evidence, retest, invalidation, and exit management.

HOW TO USE THE SYSTEM

Trading Analytica builds a comprehensive context map. Here is how a disciplined operator uses that map to plan lower-risk entries.

1. Build a Thesis

Do not trade blindly. Combine structure, liquidity, and pressure to form a clear idea.

2. Wait for Location

Retests matter. Use planned limit orders instead of chasing market candles into support/resistance.

3. Size by Quality

Market character changes daily. A valid idea in a degraded environment deserves probe risk, not full risk.