Asia short leg
05:30-12:35 ISTMove
1.16356 -> 1.16230
Distance
12.6p
Early pressure pushed through yesterday's low. The key was not the break itself, but whether price could accept below it.
This study reviews the exact sequence we followed live: prior-day low sweep, London reclaim, premium supply rejection, bearish session delta, and the executed sell-limit rows.
This page explains a recorded market sequence and operator review. It is not a promise that future setups will behave the same way, and it is not personal financial advice.
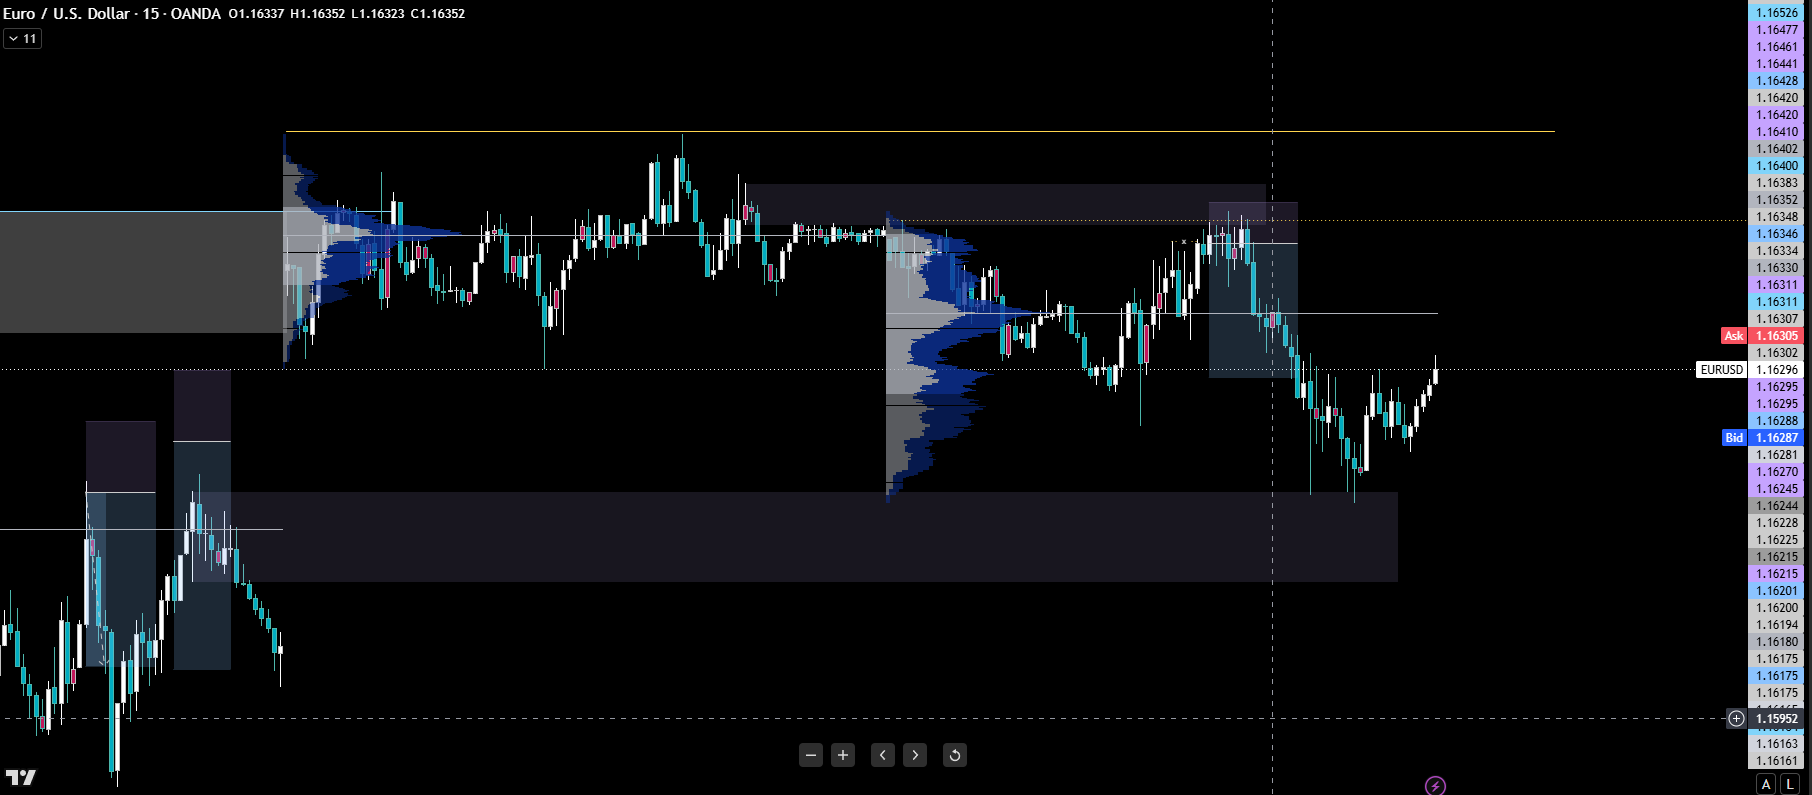
The prior-day low became the key decision pivot after Tuesday's sweep.
Price pierced the prior-day low by 6.0 pips before reclaiming.
The rally stopped inside the overhead supply shelf.
The rejection leg rotated through the prior low and extended lower.
The trade did not come from one candle. It came from watching the auction change state across sessions.
Early pressure pushed through yesterday's low. The key was not the break itself, but whether price could accept below it.
The reclaim produced a squeeze into upper value. That made the top attractive only if supply actually rejected the rally.
The clean short sequence. Price failed in premium, then rotated back through the swept decision pivot.
Late-session absorption warned against chasing fresh shorts after the main rotation had already paid.
The trade worked because entry was placed at premium location. Price rallied from the swept low into the strongest overhead shelf, failed to accept above London high, then rotated down through the prior-day low and into the lower session bracket.
Sell limits 0.41 + trapped longs 3.44
Densest local sell shelf. This is why the 1.16425 sell was not random.
Upper-value resistance plus trapped-long pressure
First pressure shelf below the London high.
Sell limits 0.84 + trapped longs 1.73
London high and final rejection cap.
The auction was not saying "short forever." It was saying the upper value test failed. Once price rejected 1.16425-1.16450 and session delta stayed negative, the clean rotation target was back toward the swept prior-day low around 1.16290, with deeper extension only if that pivot failed.
These screenshots are used as operator review evidence. The system builds the map, but the operator still owns size, entry, stop, target, and exit management.

SELL 3.0 lots at 1.16425, closed near 1.16289, visible result +$408.

Two additional sell rows around 1.16413-1.16415, closed near 1.16287, visible combined result +$892.
The goal is not to memorize one level. The goal is to learn how the system changes its read as price moves.
Once 1.16290 was pierced to 1.16230 and reclaimed, it changed character. It became a decision pivot: reclaim is bullish, loss of reclaim is bearish.
The global positioning ratio was not extreme. The useful clue was local trapped inventory: overhead trapped longs near 1.16400-1.16450 and later support/absorption near the lows.
The sell was placed inside the strongest overhead supply shelf. Selling 1.16425 is different from chasing 1.16250 after the move already happened.
After the rotation into 1.16150, the system shifted to absorption near the lows. That is why the earlier short was clean, but late chasing was lower quality.
Public wording should describe this as institutional-style absorption or large passive supply. We can show the evidence stack, but we should not claim we know the identity of the participants.